Hi, and welcome!
Please see the FAQ: What's a reproducible example (`reprex`) and how do I create one? Using a reprex, complete with representative data will attract quicker and more answers. Not needed here, but good to keep in mind.
See this example from the predict.lm{stats} help page
x <- rnorm(15)
y <- x + rnorm(15)
predict(lm(y ~ x))
#> 1 2 3 4 5 6
#> 0.25960090 0.91609553 0.77051055 0.27562176 0.40192878 0.58395211
#> 7 8 9 10 11 12
#> -0.06984815 0.07619936 -0.24433707 -1.14242924 -0.12167502 -0.29181949
#> 13 14 15
#> 0.59843283 0.56245740 -0.31719619
new <- data.frame(x = seq(-3, 3, 0.5))
predict(lm(y ~ x), new, se.fit = TRUE)
#> $fit
#> 1 2 3 4 5 6
#> -1.55072900 -1.25306378 -0.95539856 -0.65773335 -0.36006813 -0.06240291
#> 7 8 9 10 11 12
#> 0.23526230 0.53292752 0.83059274 1.12825795 1.42592317 1.72358839
#> 13
#> 2.02125360
#>
#> $se.fit
#> 1 2 3 4 5 6 7 8
#> 0.8581513 0.7218424 0.5890542 0.4628272 0.3503269 0.2693410 0.2523015 0.3099407
#> 9 10 11 12 13
#> 0.4120269 0.5336337 0.6641230 0.7991555 0.9367687
#>
#> $df
#> [1] 13
#>
#> $residual.scale
#> [1] 0.9642231
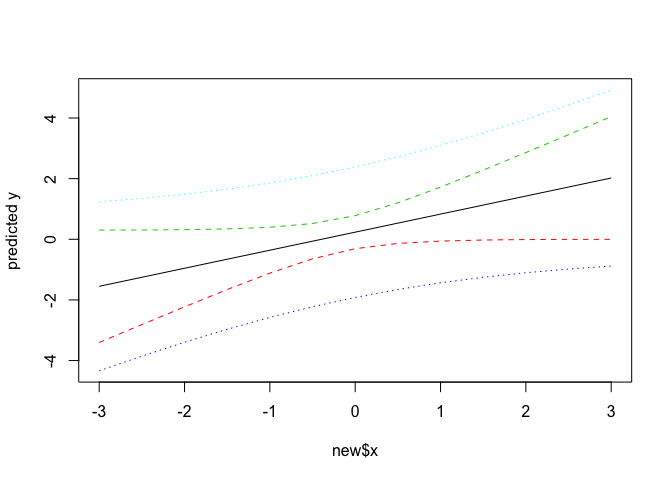
pred.w.plim <- predict(lm(y ~ x), new, interval = "prediction")
pred.w.clim <- predict(lm(y ~ x), new, interval = "confidence")
matplot(new$x, cbind(pred.w.clim, pred.w.plim[,-1]),
lty = c(1,2,2,3,3), type = "l", ylab = "predicted y")
Created on 2020-03-06 by the reprex package (v0.3.0)