It's possible to do exactly as you describe, to set the x axes to categorical variables of a, b, c, and d.
library(tidyverse);
library(ggrepel) # handy for placing data labels
df1 <- data.frame(a = 0, b = 0, c = 1, d = 1)
df2 <- data.frame(a = 0, b = 1, c = 1, d = 0)
combo <-
rbind(df1, df2) %>%
rowid_to_column(var = "source") %>%
# This will put it into a tidy format
gather(category, value, a:d)
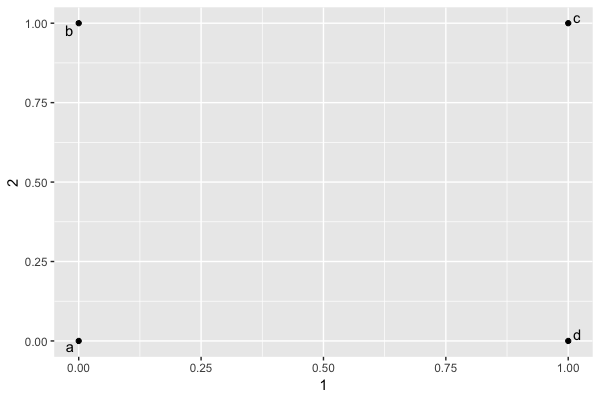
combo %>%
# ...but for this particular case it helps to spread by data source
spread(source, value) %>%
ggplot(aes(`1`, `2`, label = category)) +
geom_point() +
ggrepel::geom_text_repel()