Indeed, loess can be complicated too, i also had some cases where it introduced a large bend to reach the upper-most points, so the loess-fit actually seemed non-monotonic.
I guess we can't predict the outcome, due to the ranked nature of spearman correlation. To a given x we can eventually only predict the rank of the y (e.g. between rank 11 and 12) - however projected back on the data dimension this could still mean somewhere between let's say 50.000 and 150.000, without knowing if it's closer to the first or the latter.
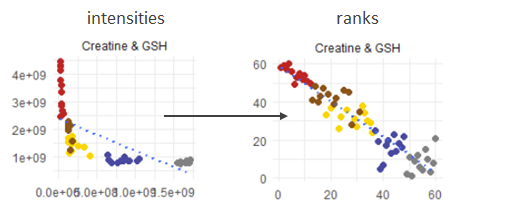
I think the mathematically closest solution is to calculate the ranks and plot rank(y) vs. rank(x) that should be linear again?
So it shows at least why the spearman correlation is so good (or bad) as it is, but clearly it removes the original dimensionality. Hmm... ![]()