Since you haven't given much to go on about your data, I have provided the quickest way I can think of.
If you need a better answer, I suggest you provide some more context, and preferably a reproducible example - see how to create a reprex
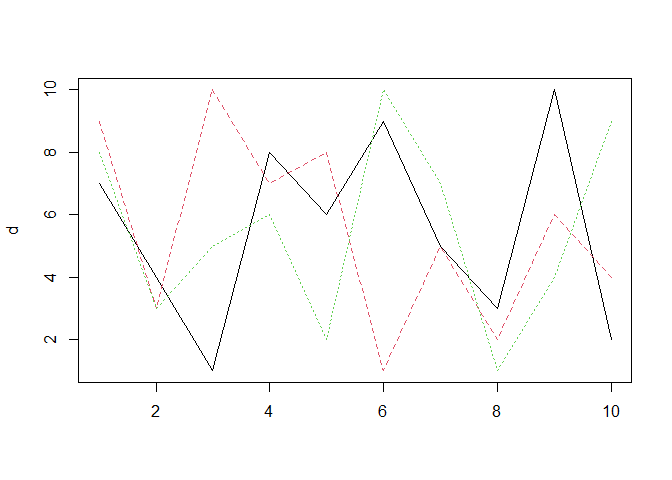
Any way, this will do something like what you are looking for
d <- replicate(3, sample(1:10))

matplot(d, type = 'l')