Sorry, I don't think I have clearly expressed my problem. So I found an example to illustrate it.
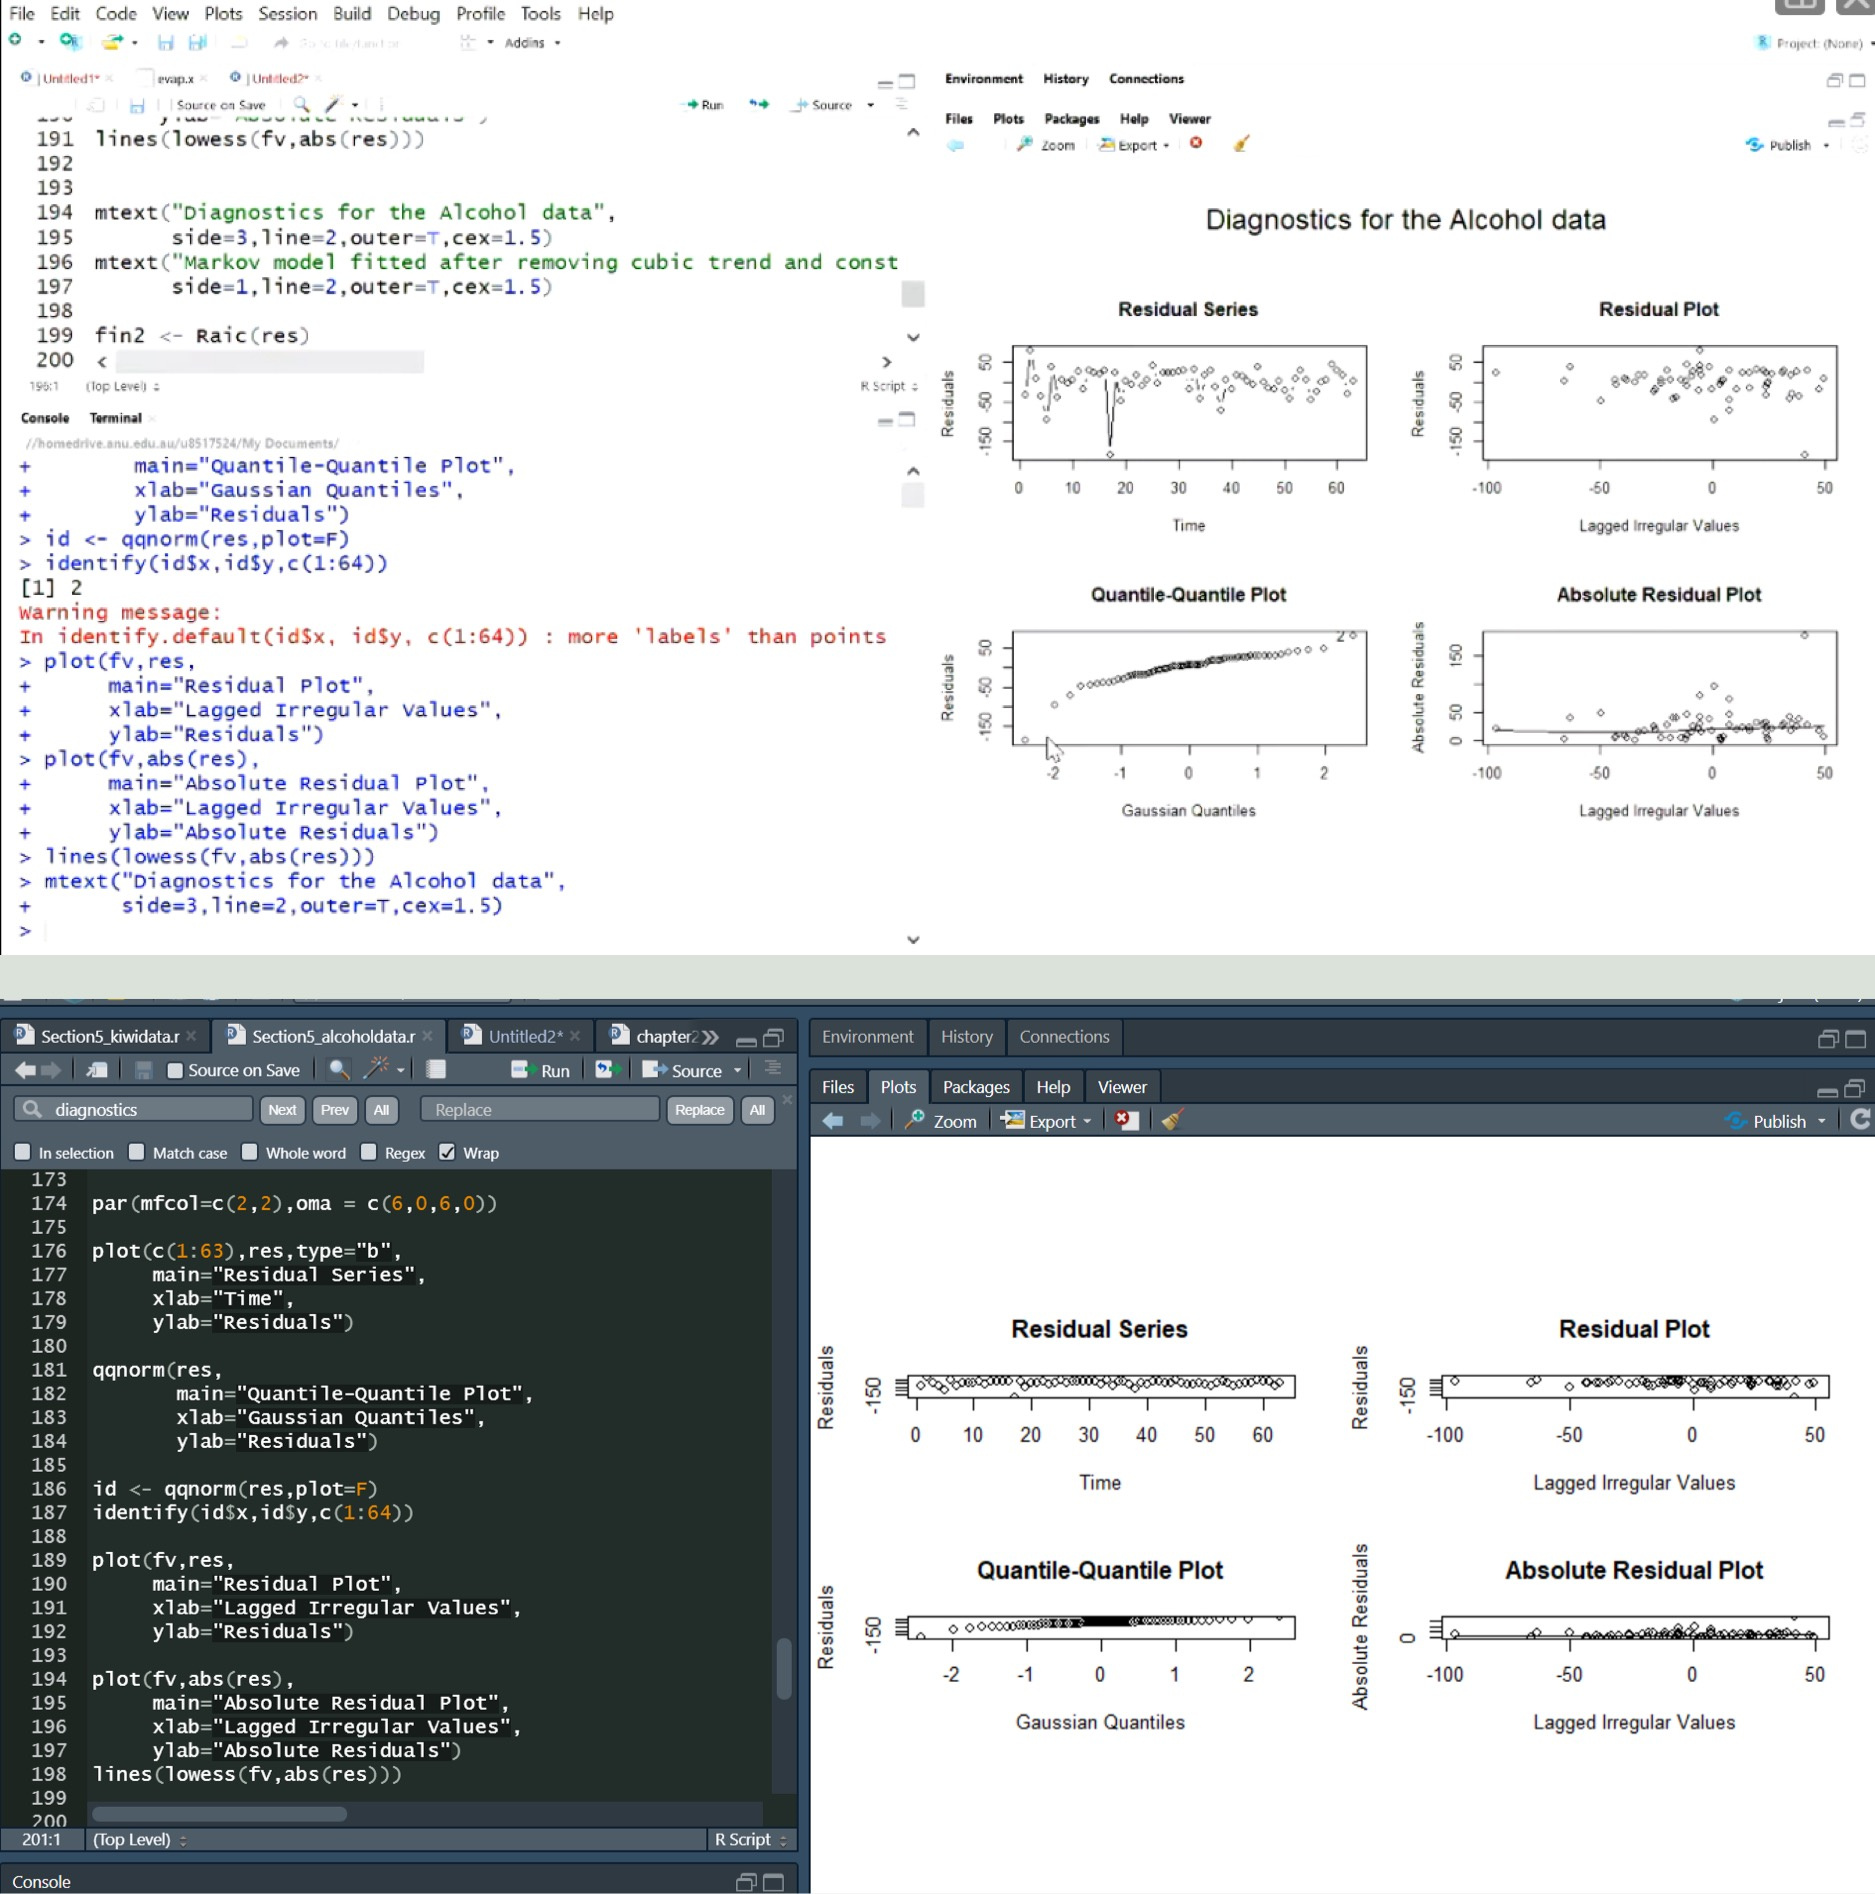
The first image below is the normal look of the multiple graphics displayed. The scale of plots all in a suitable size.
However, I tried to use the same code to plot the same graphics using my Rstudio, it showed a different scale of x and y axes(As shown in the second image below). I don't know what's wrong with it and I want to fix it. I've already maximized my plot pane and no matter how I drag the border, I can't get the normal scale of the graph.