For your future posts, please provide your dataset in a copy-paste friendly format. You can use dput or datapasta for that. It'll be also preferable if you provide a reproducible example, as it shows your efforts and problems that you faced, and hence it helps people to help you. Please go through FAQ: How to do a minimal reproducible example ( reprex ) for beginners.
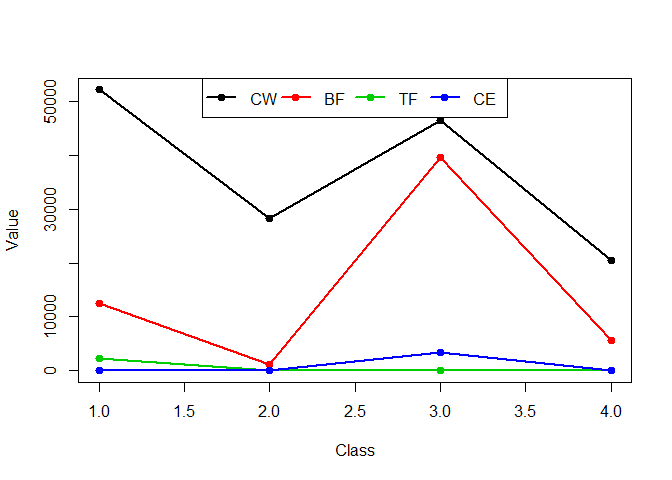
dataset <- data.frame(CW = c(52095, 28312, 46430, 20385),
                      BF = c(12456, 1132, 39640, 5660),
                      TF = c(2265, 0, 0, 0),
                      CE = c(0, 0, 3397, 0),
                      row.names = c("Cla", "Clb", "Clc", "Cld"))

matplot(x = dataset,
        type = "o",
        lty = 1,
        lwd = 2,
        pch = 19,
        xlab = "Class",
        ylab = "Value")
legend(x = "top",
       legend = names(x = dataset),
       col = 1:4,
       lty = 1,
       lwd = 2,
       pch = 19,
       ncol = 4)
Created on 2019-06-18 by the reprex package (v0.3.0)
You can rotate the y-axis labels using las = 1 and discard the box containing the legend using bty = "n".
Hope this helps.