See the FAQ: How to do a minimal reproducible example reprex for beginners.
Cut and paste the code below. It should produce a blank canvas—because nothing more was requested.
suppressPackageStartupMessages({
  library(ggplot2)
})

ggplot(mtcars,(aes(mpg,hp)))
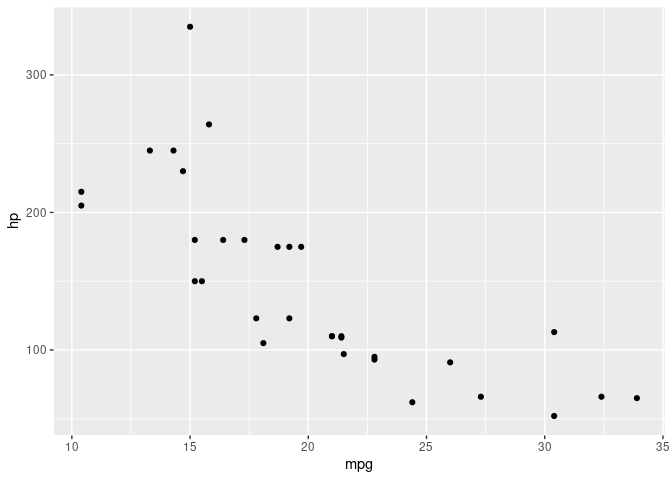
The following snippet plots the data as points
suppressPackageStartupMessages({
  library(ggplot2)
})

ggplot(mtcars,(aes(mpg,hp))) + geom_point()