You should narrow down your code to just the relevant part, with all that extra code your issue looks harder than it actually is. I think this is what you are trying to accomplish
library(ggplot2)
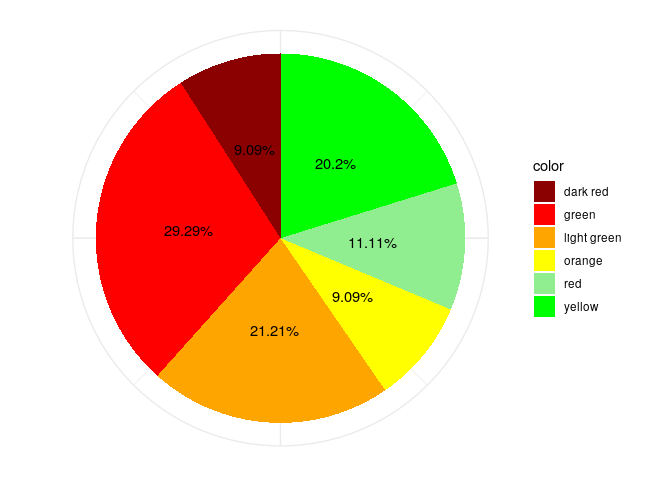
total <- data.frame(
stringsAsFactors = FALSE,
Freq = c(9L, 11L, 9L, 20L, 21L, 29L),
prop = c(9.09, 11.11, 9.09, 20.2, 21.21, 29.29),
lab.ypos = c(4.545, 74.235, 64.135, 89.89, 48.985, 23.735),
prop.mod = c("9.09%", "11.11%", "9.09%", "20.2%", "21.21%", "29.29%"),
color = as.factor(c("dark red",
"red","orange","yellow","light green",
"green"))
)
mycols <- c("darkred", "red", "orange", "yellow", "lightgreen", "green")
ggplot(total, aes(x = "", y = prop / 100, fill = color)) +
geom_col(width = 1) +
coord_polar("y", start = 0) +
geom_text(aes(x = 1, label = prop.mod),
position = position_stack(vjust = 0.5)) +
scale_fill_manual(values = mycols) +
theme_minimal() +
theme(axis.text.x=element_blank(),
axis.title.x = element_blank(),
axis.title.y = element_blank())
Created on 2020-03-15 by the reprex package (v0.3.0.9001)