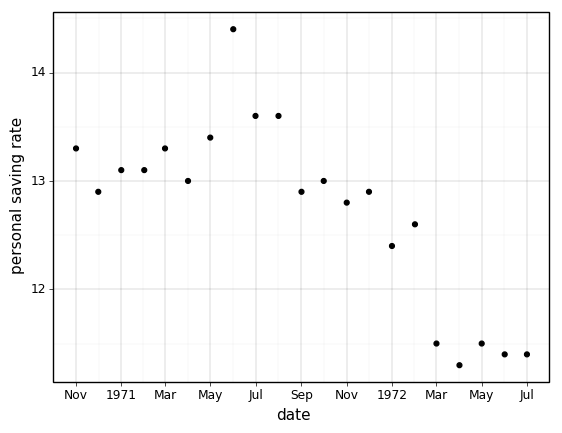
I try to get the last graph shown on the site, with its functions:
def custom_date_format3(breaks):
"""
Function to format the date
"""
res = []
for x in breaks:
# First day of the year
if x.month == 1:
fmt = '%Y'
else:
fmt = '%b'
res.append(date.strftime(x, fmt))
return res
def custom_date_breaks(width=None):
"""
Create a function that calculates date breaks
It delegates the work to `date_breaks`
"""
def filter_func(limits):
breaks = date_breaks(width)(limits)
# filter
return [x for x in breaks if x.month % 2]
return filter_func
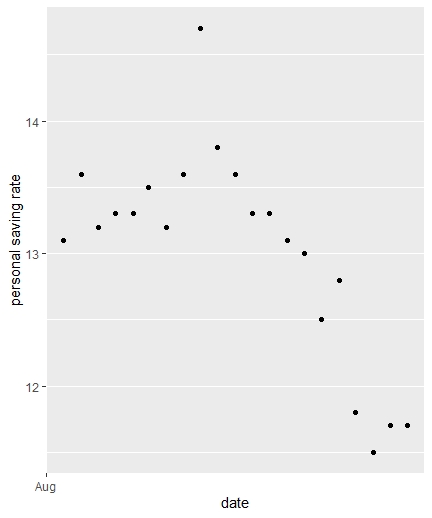
(ggplot(economics.loc[40:60, :])
+ geom_point(aes('date', 'psavert'))
+ scale_x_datetime( # modified
breaks=custom_date_breaks('1 months'),
labels=custom_date_format3)
+ labs(y='personal saving rate')
)
and did not achieve the expected graph.
and did not achieve the expected graph.
These are the functions i use
custom_date_format3<-function(x){
  res<-c()
  fmt<-dplyr::case_when(
    month(x) == 1 ~ "%Y",
    TRUE ~ "%b")# first pass
      # last pass
  res<-c(res,format(x,fmt))
    return(res)
}
custom_date_breaks<-function(x){
 #m<-c(0)
 m = structure(rep(NA_real_, 1 ), class="Date")
 rpt<-dplyr::case_when(month(x) %% 2==0 ~ x)
 m<-c(m,rpt)
  return(m)
}

(DT[,ggplot(.SD[40:60],mapping=aes(date, psavert))
  + geom_point()
  + scale_x_date(                                       # modified
    breaks=custom_date_breaks,
    labels=custom_date_format3)
  + labs(y='personal saving rate'),]
)
and the graph I get: