Welcome to RStudio Community.
It is useful to provide a reproducible example (reprex) so that helpers can use your own data. As you haven't, I'm going to create some dummy data. I'll be using the tidyverse to do so.
library(tidyverse)

df = tibble(date = c("1/1/2020", "2/1/2020", "3/1/2020", "4/1/2020", "5/1/2020"),
            val = 1:5)

df
#> # A tibble: 5 x 2
#>   date       val
#>   <chr>    <int>
#> 1 1/1/2020     1
#> 2 2/1/2020     2
#> 3 3/1/2020     3
#> 4 4/1/2020     4
#> 5 5/1/2020     5
Your dates might be already correctly formatted, but mine currently aren't. I'm going to fix that by using {lubridate}.
library(lubridate)

df = df |>
  mutate(date = dmy(date))
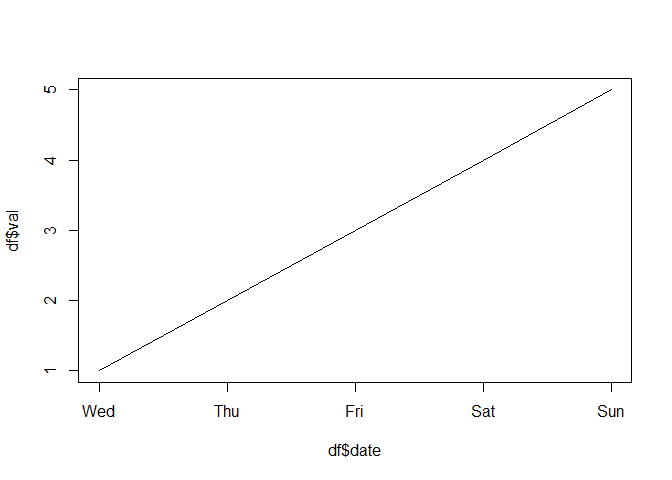
Now we can make a plot. We can use R's default plot() function to do so:
plot(x = df$date, y = df$val, type = "l")
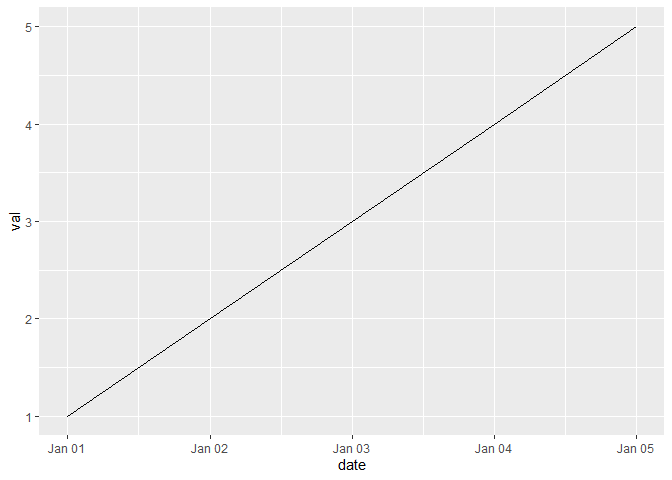
However, many people use the powerful {ggplot2} package to plot nowadays.
ggplot(df, aes(x = date, y = val)) +
  geom_line()
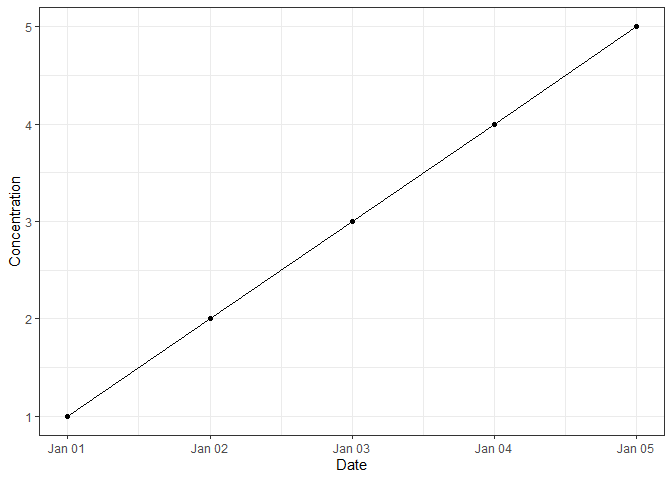
{ggplot2} allows us to f inesse our plots really easily.
ggplot(df, aes(x = date, y = val)) +
  geom_line() +
  geom_point() +
  theme_bw() +
  labs(x = "Date", y = "Concentration")
Created on 2022-01-12 by the reprex package (v2.0.1)