Hi Jonspring,
I have some doubts, please correct me, if I m wrong.
sensor_data <- data.table::fread("org_data.csv") %>%
  # convert localminute to datetime (fread imports it as character)
   mutate(localminute = lubridate::as_datetime(localminute)) %>%
  group_by(dataid) %>%
  arrange(localminute, .by_group = TRUE) %>%
 mutate(interval_hr = (localminute - lag(localminute)) / lubridate::dhours(1),
 meter_change = meter_value - lag(meter_value)) %>%  ungroup()

 print(sensor_data)
 # A tibble: 1,584,823 x 5
   localminute         dataid meter_value interval_hr meter_change
   <dttm>               <int>       <int>       <dbl>        <int>
 1 2015-10-01 05:14:44     35       93470     NA                NA
 2 2015-10-01 05:42:34     35       93470      0.464             0
 3 2015-10-01 07:02:37     35       93470      1.33              0
 4 2015-10-01 07:12:38     35       93470      0.167             0
 5 2015-10-01 07:20:36     35       93470      0.133             0
 6 2015-10-01 07:23:39     35       93470      0.0508            0
 7 2015-10-01 08:59:41     35       93470      1.60              0
 8 2015-10-01 09:30:40     35       93470      0.516             0
 9 2015-10-01 09:34:37     35       93470      0.0658            0
10 2015-10-01 10:14:35     35       93470      0.666             0
# ... with 1,584,813 more rows
"","localminute","dataid","meter_value","interval_hr","meter_change"  # to see 1,584,813 more rows, i export to csv file
"12",2015-10-01 11:23:36,35,93472,1.10111111111111,2
```````````````````````````````````````````````
What is the meaning of interval_hr = (localminute - lag(localminute)) / lubridate::dhours(1)?
How the meter_change is calculated, as I saw some dataid has value in meter_change?
Ungroup() meaning?
'function: sensor_data' is listing all the meter_value with meter_changes, means that: including spiky data and non-spiky data?
the list in 'function: noisy_readings' is filtered from 'sensor_data function'?
# Which have noisy data? (assuming a negative change indicates an error)
noisy_readings <-
  sensor_data %>%
  filter(meter_change < -100)   # Setting here to ignore small changes

  > print(noisy_readings)
  # A tibble: 1,094 x 5
   localminute         dataid meter_value interval_hr meter_change
   <dttm>               <int>       <int>       <dbl>        <int>
 1 2015-12-07 23:19:59   1185      144548      0.231        -17798  #this data was no in "sensor_data"function, when i extract
 2 2015-12-08 00:21:50   1185      144550      0.0928       -17798
 3 2015-12-08 01:58:12   1185      144558      0.0978       -17792
 4 2015-12-08 02:12:12   1185      144558      0.0661       -17792
 5 2015-12-08 02:34:59   1185      144558      0.0292       -17792
 6 2015-12-08 03:20:06   1185      144558      0.699        -17792
 7 2015-12-08 03:58:58   1185      144558      0.364        -17792
 8 2015-12-08 05:09:55   1185      144558      1.06         -17792
 9 2015-12-08 07:05:02   1185      144560      0.0325       -17792
10 2015-12-08 07:52:51   1185      144592      0.0453       -17760
# ... with 1,084 more rows
> noisy_meters <- unique(noisy_readings$dataid)
> print(noisy_meters)
 [1] 1185 1556 2335 2449 3134 3544 4514 5129 5403 6836 7030 7117 8156 9134 9639 9982
'function: noisy_meters' is listing the noisy dataid from the noisy_readings?
Is that what unique function meaning?
 > noisy_ranges <-
  noisy_readings %>%
  group_by(dataid) %>%
  summarize(min_range = min(localminute) - 60*60*24*3,
            max_range = max(localminute) + 60*60*24*3)
'function: noisy_ranges' meaning arranging a list of noisy dataid, starting with their minimum localminute to maximum localminute?
eg. for dataid =1185, arrange its' noisy data start from miniimum localminute (2015-12-04 23:19:59) to maximum localminute (2015-12-16 07:27:54)?
As u said "606024 is one day", but why multiple by 3?
> print(noisy_ranges)
> # A tibble: 16 x 3
>    dataid min_range           max_range
>     <int> <dttm>              <dttm>
>  1   1185 2015-12-04 23:19:59 2015-12-16 07:27:54
>  2   1556 2015-12-05 08:36:42 2015-12-14 08:14:36
>  3   2335 2015-12-05 22:33:26 2015-12-15 05:52:27
>  4   2449 2015-12-04 23:07:19 2015-12-16 07:34:19
>  5   3134 2015-12-05 12:56:40 2015-12-15 23:10:28
>  6   3544 2015-12-05 01:49:52 2015-12-16 00:48:35
>  7   4514 2015-12-04 22:41:04 2015-12-16 07:19:59
>  8   5129 2015-12-04 23:10:13 2015-12-16 08:02:14
>  9   5403 2015-12-04 23:42:18 2015-12-16 06:38:00
> 10   6836 2015-12-05 02:07:34 2015-12-16 05:56:47
> 11   7030 2015-12-04 23:54:21 2015-12-16 07:20:11
> 12   7117 2015-12-04 23:15:09 2015-12-16 07:12:02
> 13   8156 2015-12-04 22:47:45 2015-12-16 06:53:41
> 14   9134 2015-12-04 23:16:58 2015-12-16 08:01:12
> 15   9639 2015-12-19 06:27:07 2015-12-25 17:54:52
> 16   9982 2015-12-06 02:31:41 2015-12-14 18:29:49
> noisy_context <-
  sensor_data %>%
  left_join(noisy_ranges) %>%
  filter(localminute >= min_range,
         localminute <= max_range)

> print(noisy_context)
# A tibble: 13,913 x 7
   localminute         dataid meter_value interval_hr meter_change min_range
   <dttm>               <int>       <int>       <dbl>        <int> <dttm>
 1 2015-12-04 23:22:06   1185      143862      0.266             0 2015-12-04 23:19:59
 2 2015-12-04 23:36:07   1185      143864      0.234             2 2015-12-04 23:19:59
 3 2015-12-04 23:51:06   1185      143864      0.250             0 2015-12-04 23:19:59
 4 2015-12-05 00:19:02   1185      143868      0.466             4 2015-12-04 23:19:59
 5 2015-12-05 00:42:54   1185      143874      0.398             6 2015-12-04 23:19:59
 6 2015-12-05 00:45:58   1185      143874      0.0511            0 2015-12-04 23:19:59
 7 2015-12-05 00:57:53   1185      143874      0.199             0 2015-12-04 23:19:59
 8 2015-12-05 01:14:53   1185      143876      0.283             2 2015-12-04 23:19:59
 9 2015-12-05 01:29:54   1185      143876      0.250             0 2015-12-04 23:19:59
10 2015-12-05 01:31:57   1185      143876      0.0342            0 2015-12-04 23:19:59
# ... with 13,903 more rows, and 1 more variable: max_range <dttm>
I am confused about this 'function:noisy_context'. Why we need to create this 'noisy_context' data frame?
I tried plotting only one noisy dataid, what is the meaning of meter_value <= lead(meter_value)?
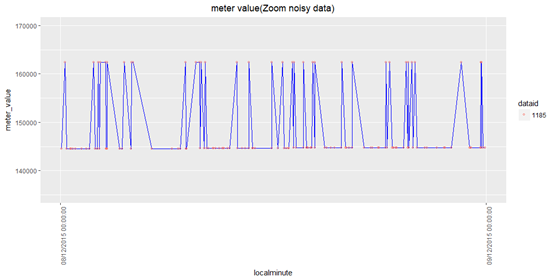
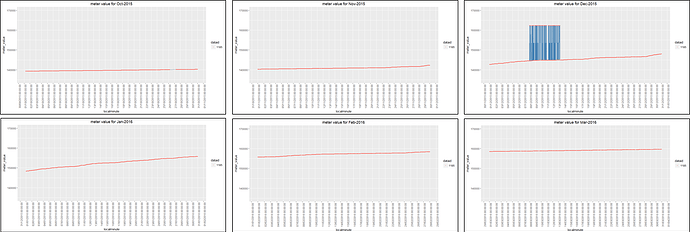
Looks like the data are overlapping, so couldnot clearly see the 3 different colours
ggplot(noisy_context %>% filter(dataid %in% c(4514)), aes(localminute, meter_value,
group = dataid, label = dataid,
color = meter_value <= lead(meter_value))) +
geom_point(shape = 1, alpha = 0.4) +
geom_line(alpha = 0.3) +
scale_y_continuous(labels = scales::comma) +
scale_x_datetime(date_breaks = "1 day", date_labels = "%b\n%d") +
facet_wrap(~dataid, scales = "free")


