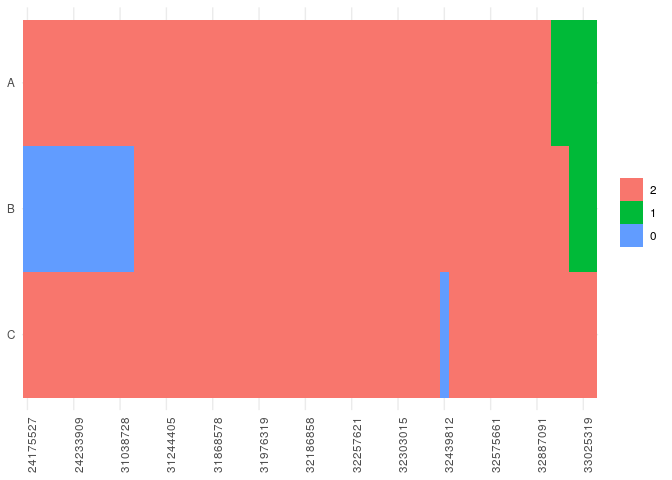
Well, this is a dirty hack but it works
sample_df %>%
    gather(variable, value, A:C) %>%
    ggplot(aes(x = as.factor(position),
               y = reorder(variable, desc(variable)),
               fill = factor(value, levels = c(2, 1, 0)))
    ) +
    geom_tile() +
    theme_minimal() +
    theme(axis.text.x = element_text(angle=90, hjust=1, vjust=1),
          axis.title = element_blank(),
          legend.title = element_blank()) +
    scale_x_discrete(breaks = sample_df$position[c(TRUE, FALSE, FALSE, FALSE, FALSE)])