How questions, such as this, generally require a reprex. See the FAQ. In particular, the process() function is unknown and modelbt() appears to be from a function from outside of the R/Bioconductor mainstream the documentation for which appears to be paywalled. There is an online course but applications closed on 14 Feb. In addition, the link that the author/instructor provides for the R package download does not have either a binary or source code available.
That's not how things are supposed to work in an open-source environment.
So let's discuss, instead, the what question.
Problems to be addressed under R benefit from the application of f(x) = y—just like school algebra.
x is the data object at hand. y is the object desired and f is the function object to transform the one into the other. Any of these may be, and usually are, composite. In the case of the data described
x is a set of variables, which may be continuous, binary or categorical, y is another variable which may similarly be one of those types. In general, we are interested in evaluating P(Y|X), the probability of observing a output given an input. For that task, R provides no end of statistical tools. For example, a binary outcome might be modeled with glm() as a logistic regression model, as I discuss here.
Most of those tools provide some measure of association such as correlation and we constantly hear correlation does not imply causation because of endless examples of spurious correlation between otherwise unrelated datasets. Folklore for children notwithstanding no one has come up with a plausible causal connection between stork populations in Northern Europe and births even in light of their high degree of correlation.
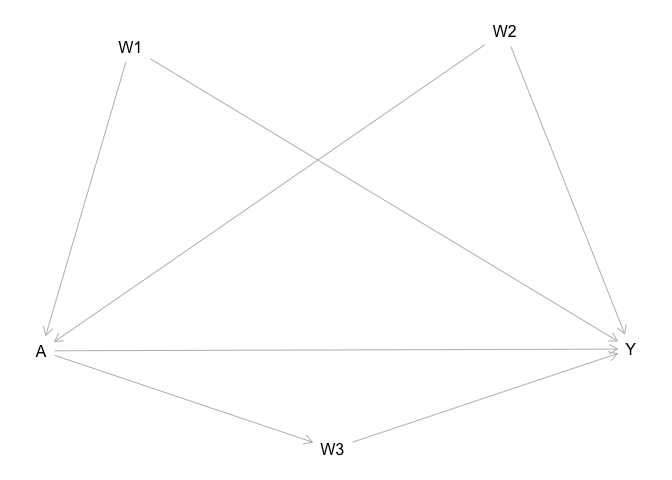
But stopping at that point neglects opportunities for casual inference that do exist by considering carefully all the relationships among variables. x_1 may have a direct effect on y or an indirect effect by its effect on x_2, which is usually what we think of as a mediator. However, there are also colliders and confounders to take into account, as explained by Judea Pearl, who also has a popular account, The Book of Why. R has tools, such as daggity as illustrated by this example
library(dagitty)

dag <- dagitty(
  'dag {
A [exposure,pos="-1.243,0.333"]
W1 [pos="-1.031,-0.585"]
W2 [pos="-0.140,-0.632"]
W3 [pos="-0.550,0.629"]
Y [outcome,pos="0.160,0.328"]
A -> W3
A -> Y
W1 -> A
W1 -> Y
W2 -> A
W2 -> Y
W3 -> Y
}'
)
plot(dag)
Created on 2023-02-17 with reprex v2.0.2
The principles underlying the use of this package in the analysis of directed acyclic graphs is described in the introductory article for the package. By undertaking this type of analysis, it is possible to untangle the roles of variables and make appropriate adjustments.
Coding a solution using other packages, such as {mediation} becomes much easier after a preliminary focus on what before jumping in.