Try something like this. I don't have your data so I have made it up. But yours will be similar.
library(tidyverse)
library(sf)
# read in postcodes for qld
postcodes <- st_read("POA_2021_AUST_GDA2020.shp") %>%
select(POA_CODE21) %>%
filter(str_starts(POA_CODE21, "4")) %>%
rename(postcode = POA_CODE21)
# fake data
df <- tribble(~postcode, ~q3,
"4000", 1,
"4005", 2,
"4006", 3,
"4007", 4,
"4008", 5,
"4009", 4,
"4010", 3)
# postcodes joined to data
joined_data <- inner_join(postcodes, df, by = "postcode")
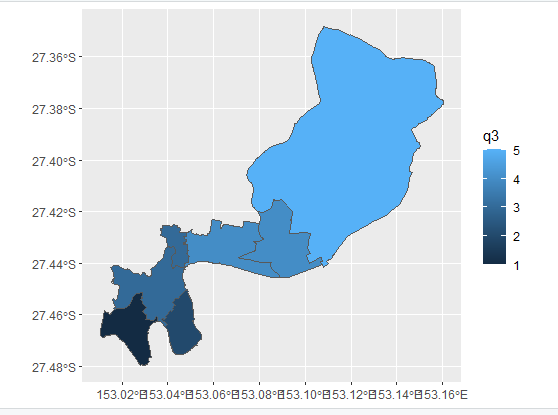
# map
ggplot(joined_data) +
geom_sf(aes(fill = q3))