Thank you very much for your reply, yes that definately gets closer!
I was hoping to obtain a boxplot similar to this:
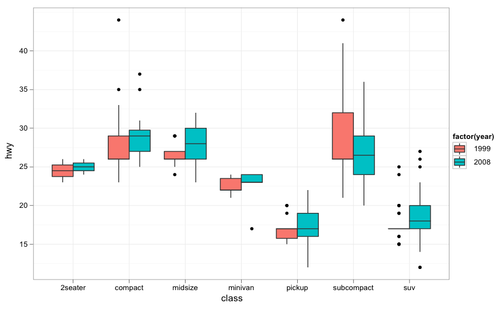
Where x-axis is the years 2014, 2017 and 2018, y axis the mean and the subgroups are the sandbanks Goote & Thornton. I thought using "fill= factor(Area)" in aes() would be sufficient for R to recognize the subgroups for each year.