I can't reproduce your problem
library(ggplot2)
sample_data <- data.frame(
stringsAsFactors = FALSE,
Date = c("14-03-20","14-03-20",
"14-03-20","14-03-20","14-03-20","14-03-20","14-03-20",
"14-03-20","14-03-20","14-03-20"),
Day = c(0, 0, 0, 0, 0, 0, 0, 0, 0, 0),
Time = c("00:00:30","00:00:30",
"00:02:30","00:02:30","00:04:30","00:04:30","00:06:30",
"00:06:30","00:08:30","00:08:30"),
Sex = c("M", "M", "M", "M", "M", "M", "M", "M", "M", "M"),
Treatment = c("CTRL","WT","CTRL","WT",
"CTRL","WT","CTRL","WT","CTRL","WT"),
Perched = c(4, 2, 1, 1, 3, 1, 2, 3, 1, 1),
Ground = c(1, 3, 4, 4, 2, 4, 3, 2, 4, 4),
Feed = c(0, 0, 0, 0, 0, 0, 0, 0, 0, 0),
Water = c(1, 0, 0, 0, 0, 0, 0, 0, 0, 0),
date_time = as.POSIXct(c("2020-03-14 00:00:30","2020-03-14 00:00:30",
"2020-03-14 00:02:30","2020-03-14 00:02:30","2020-03-14 00:04:30","2020-03-14 00:04:30",
"2020-03-14 00:06:30","2020-03-14 00:06:30","2020-03-14 00:08:30","2020-03-14 00:08:30"))
)
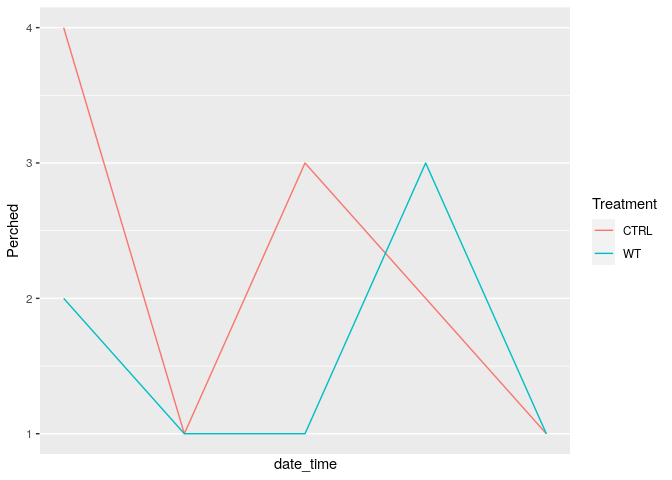
ggplot(sample_data, aes(date_time, Perched, color = Treatment)) +
geom_line() +
scale_x_datetime(breaks = "2 days")
Created on 2020-08-11 by the reprex package (v0.3.0)
Can you provide a proper REPRoducible EXample (reprex) illustrating your issue?