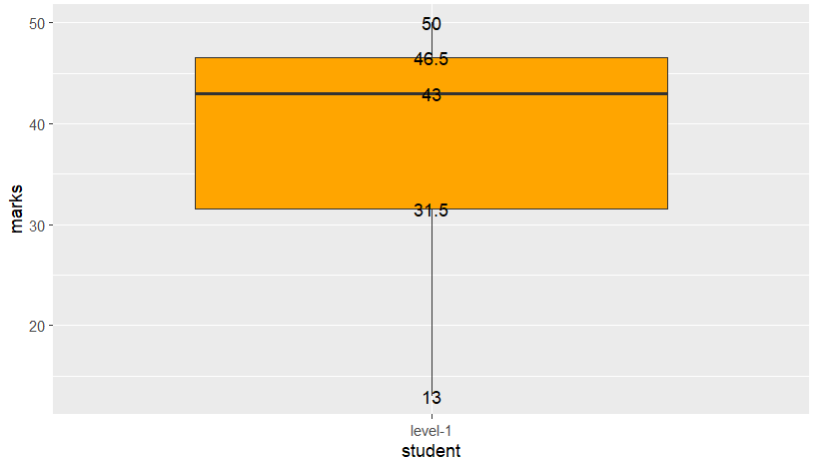
The line geom_text(aes(label=median(marks))) is inheriting the x and y from data, so the calculated median is printed for each (x,y) in the tibble.
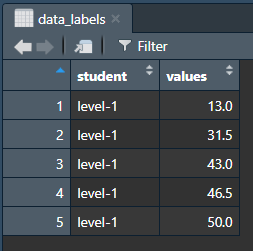
One way to handle this is to create a second tibble that provides only those values in the boxplot you want to label. Using the quantile() function, we can create the following:
data_labels = tibble(student = 'level-1',
                     values = quantile(data$marks)
                     )
which produces...
Now, replacing this in your ggplot chain and specifying data = data_labels in geom_text(),
ggplot(data,aes(student,marks))+
  geom_boxplot(fill="orange")+
  geom_text(data = data_labels, aes(student, values, label = values))
we end up with...