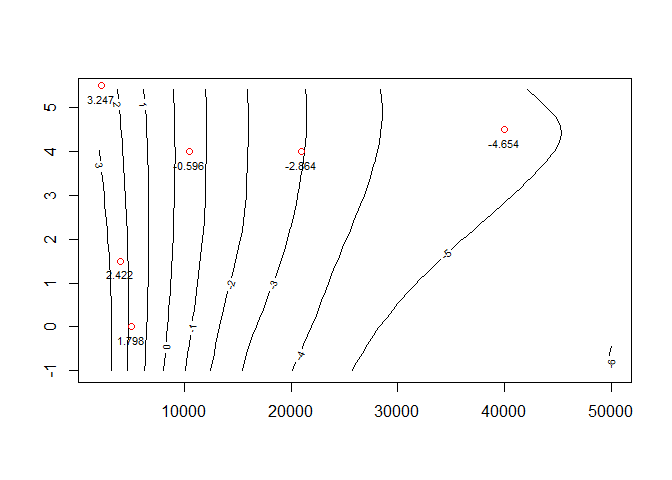
It seems you want to fit V values with repect to Teff and logg. Here is one way to do that with the loess function. Besides doing the fit, I drew a contour plot using the predicted fit and plotted a few points from the original data on it. You can see that the fit seems to match the original data reasonably well. For example the red point with a V of -0.596 falls between the contours with values of 0 and -1.
DF <- read.csv("~/R/Play/lcb98cor.dat", sep = " ")
#Fit the data
FIT <- loess(V ~ Teff + logg, data = DF)

#Define the new point and predict its V value
NewPt <- data.frame(Teff = 2300, logg = 3.86)
NewPt$Pred <- predict(object = FIT, newdata = NewPt)
NewPt
#>   Teff logg     Pred
#> 1 2300 3.86 2.892414

#Make a grid of points to use in a contour plot
GRID <- expand.grid(Teff = seq(2000, 50000, 2000), logg = seq(-1, 5.5, 0.2))
#Predict the V values on the grid
POINTS <- predict(FIT, GRID)

#Pull some random samples from the original data to plot on the contour
Samples <- DF[c(460,6653,7151, 5505, 4379, 448),]

contour(x = seq(2000, 50000, 2000), y = seq(-1, 5.5, 0.2), z = POINTS)
#plot the V values of the sampled points
text(x = Samples$Teff, y = Samples$logg, labels = Samples$V, pos = 1, cex = 0.7)
#Plot the sampled pointes
points(x = Samples$Teff, y = Samples$logg, col = "red")
Created on 2021-08-05 by the reprex package (v0.3.0)