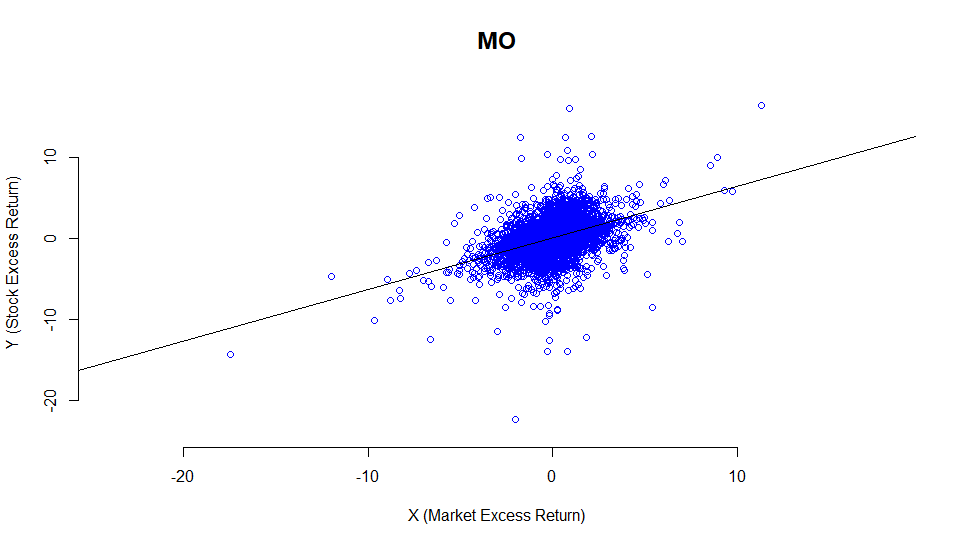
If stock holds and xts of my stock return data, and Market holds an xts of market return data, For the CAPM regression, I simply use:
    CAPMreg <- lm(Stock ~ Market)
    plot(
        as.zoo(Market),
        as.zoo(Stock),
        xlab = "X (Market Excess Return)",
        ylab = "Y (Stock Excess Return)",
        cex.main = 1.5,
        frame.plot = FALSE,
        col = "blue"
)  ##  col=ifelse((x*y<0), "red", "blue")
    abline(CAPMreg)
done - I get a beautiful plot: