Since you are new on this forum, I'm going to give you a hand with your reprex this time, but you really need to read this FAQ: What's a reproducible example (reprex) and how do I do one?
Is this close to what you want to do?
# Sample Data
df <- data.frame(
id = c(1, 2, 3, 4, 5, 6, 7, 8, 9, 10, 11, 12, 13),
nst_drought_ew = c(1, 3, 2, 2, 1, 3, 1, 1, 1, 1, 2, 4, NA),
nst_flood_mtgn = c(1, 3, 2, 3, 1, 3, 2, 1, 2, 1, 2, 3, 1),
nst_imp_lu = c(3, 3, 2, 4, 4, 4, 3, 3, 4, 3, 4, 4, NA),
nst_off_farm = c(1, 3, 4, 3, 1, 3, 2, 3, 4, 1, 4, 3, 3),
nst_agric_pract = c(3, 3, 3, 4, 3, 3, 3, 3, 4, 3, 2, 3, NA),
nst_pdates_crv = c(3, 3, 3, 4, 4, 3, 4, 4, 3, 3, 3, 4, 3),
nst_aconst = c(1, 3, 3, 1, 1, 3, 2, 3, 3, 3, 2, 1, NA),
nst_fr_cons = c(4, 3, 4, 4, 4, 2, 2, 3, 3, 1, 4, 4, NA)
)
library(dplyr)
library(tidyr)
library(ggplot2)
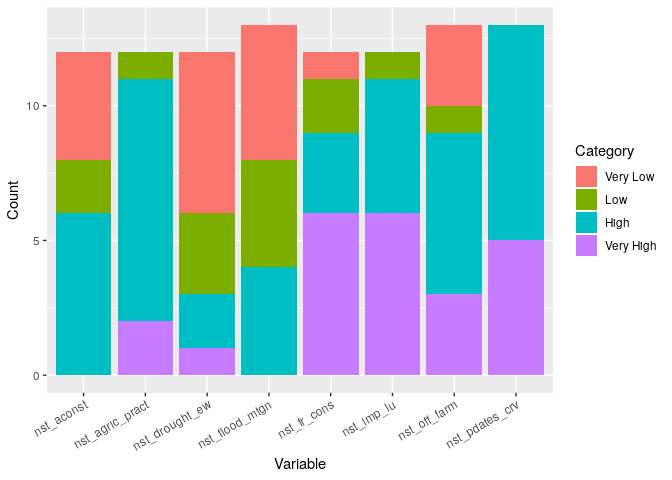
df %>%
gather(variable, category, -id) %>%
filter(!is.na(category)) %>%
count(variable, category) %>%
ggplot(aes(x = variable,
y = n,
fill = factor(category, labels = c("Very Low", "Low", "High", "Very High")))) +
geom_col() +
labs(x = "Variable",
y = "Count",
fill = "Category") +
theme(axis.text.x = element_text(angle=30, hjust=1, vjust = 1))
Created on 2019-02-12 by the reprex package (v0.2.1)