library(tidyverse)
library(openair)
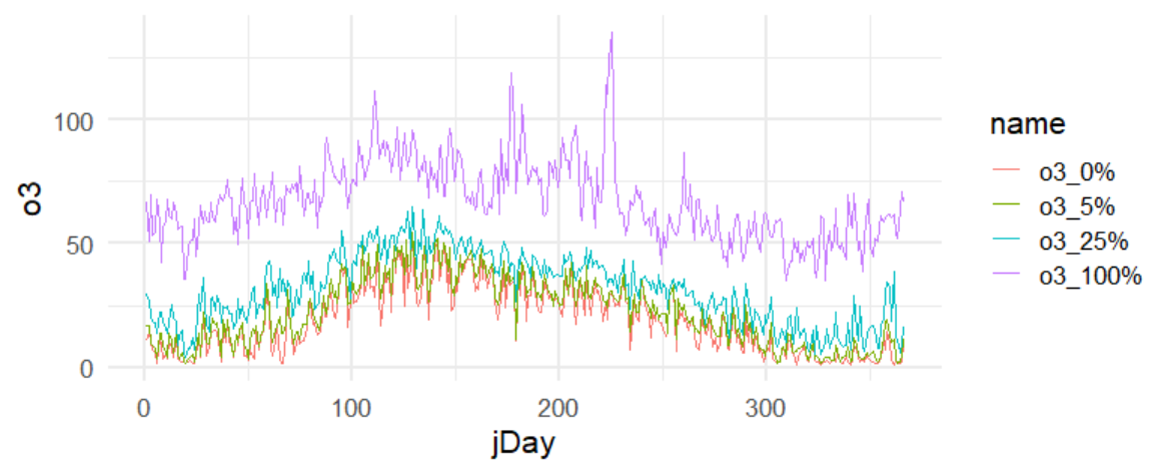
# get Ozone data for London N. Kensington site
dat <- importAURN(site = "kc1",
data_type = "daily",
pollutant = "o3",
year = 2010:2020)
# create day in the year column
dat <- dat %>%
mutate(jDay = yday(date))
dat
qs <- c(0,0.05,.25,1)
# the quantile method itself is capable of outputting results for each quantile requested
(qdf_option_a <- group_by(
dat,
jDay
) |>
summarise(across(
.cols = o3,
.fns = \(x)
as.data.frame(rbind(quantile(x, probs = qs,na.rm=TRUE)))
,.unpack = TRUE))|> pivot_longer(-jDay) |> mutate(name=as_factor(name)))
# Begin alternative to make quantile data frame #
# if you had to use quantile multiple times each time to get a different quantile
# you might do ...
# prep qdf_option_b
qfuncs <- lapply(qs, \(q){
function(x) {
quantile(x,
probs = q, na.rm = TRUE
)
}
}) |>
setNames(paste0("q_", qs))
(qdf_option_b <- group_by(
dat,
jDay
) |>
summarise(across(
.cols = o3,
.fns = qfuncs
)) |>
pivot_longer(cols = -jDay) |> mutate(name=as_factor(name)))
# END DATA PREP
ggplot(data = dat,
aes(x = jDay, y = o3)) +
# geom_point(alpha=.05)+
theme_minimal(base_size = 16)+
geom_line(data=qdf_option_a,
mapping = aes(y=value,color=name))
1 Like