After many (many, many, many) trials and errors I have finally figured out a way to get all my simulation results out of the foreach() %dopar% loop. Early on I reckoned that they had to be combined into a list object, it was teasing them apart afterward that was challenging.
Here's a reprex() of my simulation, modeling and results-extraction code. I'm pretty sure the way I'm doing it is less than optimal but hey, it works!
library(tidyverse)
library(lme4)
#> Loading required package: Matrix
#>
#> Attaching package: 'Matrix'
#> The following object is masked from 'package:tidyr':
#>
#> expand
library(parallel)
library(foreach)
#>
#> Attaching package: 'foreach'
#> The following objects are masked from 'package:purrr':
#>
#> accumulate, when
library(doParallel)
#> Loading required package: iterators
# Set simulation parameters
nsubj <- 500 # Total number of subjects, randomly split into two roughly equal groups
nreps <- 20 # Number of simulation repetitions
par0 <- -5.0 # Mean of random intercepts
par0sd <- 2.0 # SD of random intercepts
par1 <- 0.4 # Time effect (increase in logit per unit time)
par1sd <- 0.01 # Very small SD to make time a not quite perfectly fixed effect
par2 <- 1.0 # Difference in logit when grp=1
par3 <- 0.04 # Effect of continuous time-varying covariate
Zvar0 <- 45 # Mean of covariate in grp0
Zvar1 <- 60 # Mean of covariate in grp0
ZvarSD <- 15 # SD of covariate
SimulateMissing <- FALSE # If true this deletes about 10% of the non-t0 observations
kink <- function(t) ifelse(t==2,t+0.05,t) # Function to allow simulation of non-linear Time effect
# Define functions to estimate models and to extract results from returned list object
est_model_2ways <- function(dat) {
model <- glmer(y~time + grp + zvar + (1|subj),
data = dat,
family = binomial,
control = glmerControl(optimizer = "bobyqa"),
nAGQ = 10)
cf_grp0 <- predict(model,newdat=mutate(dat,grp=0),type='response')
cf_grp1 <- predict(model,newdat=mutate(dat,grp=1),type='response')
pop <- predict(model,newdat=dat,type='response')
model_params <- c(summary(model)$coefficients[1:4,1], as.data.frame(VarCorr(model))[1,"sdcor"] )
res <- cbind(select(dat, time, grp, simindex, y),
cf_grp0, cf_grp1, pop)
names(res) <- c("time", "grp", "simindex", "y",
"cf_grp0", "cf_grp1", "pop")
return(list(res,model_params))
}
extract_plotdat <- function(result_list,simresponse) {
moddata <- matrix()
moddata <- foreach (m=1:nreps,.combine='rbind') %do% return(result_list[[m]][[1]])
plotcf <- moddata %>%
group_by(simindex,time) %>%
summarize(cf_grp0=mean(cf_grp0),
cf_grp1=mean(cf_grp1))
plotpop <- moddata %>%
group_by(simindex, time, grp) %>%
summarize(pop_mean=mean(pop)) %>%
spread(grp,pop_mean,sep='') %>%
transmute(pop_grp0=grp0, pop_grp1=grp1)
plotdat <- merge(plotcf, plotpop) %>% merge(simresponse)
return(plotdat)
}
extract_modparams <- function(result_list) {
modparams <- matrix()
modparams <- foreach (k=1:nreps,.combine='rbind') %do% return(result_list[[k]][[2]])
colnames(modparams) <- c("Intercept", "Time", "Grp", "Zvar", "SD_Intercept")
return(modparams)
}
# Simulate some data
set.seed(20)
simdata1 <- foreach(i=1:nreps,.combine='rbind') %do% {
ds1 <- data.frame(time=rep(0:2,nsubj),
subj=rep(1:nsubj,each=3),
grp=rep(rbinom(nsubj,1,0.5),each=3))
unique <- rnorm(nsubj,par0,par0sd)
ds2 <- mutate(ds1,
zvar=ifelse(grp,rnorm(n(),Zvar1,ZvarSD),rnorm(n(),Zvar0,ZvarSD)),
logit=(unique[subj]+(rnorm(n(),par1,par1sd)*kink(time))+(grp*par2))+(par3*zvar),
prob=exp(logit)/(1+exp(logit)),
y=rbinom(n(),1,prob))
missvec <- ifelse(rep(SimulateMissing,(3*nsubj)),
as.logical(1-((ds2$subj %in% 1:(nsubj%/%8) & ds2$time==2) |
(ds2$subj %in% 1:(nsubj%/%10) & ds2$time==1))),
as.logical(rep(1,(3*nsubj))))
ds3 <- ds2 %>% filter(missvec) %>% cbind(rep(i,sum(missvec)))
names(ds3) <- c("time", "subj", "grp", "zvar", "logit", "prob", "y", "simindex")
ds3
}
simresponse1 <- simdata1 %>%
group_by(simindex, time, grp) %>%
summarize(raw_grp=mean(y)) %>%
spread(grp,raw_grp,sep='') %>%
transmute(raw_grp0=grp0, raw_grp1=grp1)
# Run a few simulation reps
cl<-makeCluster(4)
clusterExport(cl, c("nreps", "simdata1"))
clusterEvalQ(cl, require(dplyr))
#> [[1]]
#> [1] TRUE
#>
#> [[2]]
#> [1] TRUE
#>
#> [[3]]
#> [1] TRUE
#>
#> [[4]]
#> [1] TRUE
clusterEvalQ(cl, require(lme4))
#> [[1]]
#> [1] TRUE
#>
#> [[2]]
#> [1] TRUE
#>
#> [[3]]
#> [1] TRUE
#>
#> [[4]]
#> [1] TRUE
registerDoParallel(cl)
mods_scenario1 <- foreach(j=1:nreps) %dopar% est_model_2ways(filter(simdata1,simindex==j))
stopCluster(cl)
# Extract model result objects and do some graphs
modparams1 <- extract_modparams(mods_scenario1)
modparams1
#> Intercept Time Grp Zvar SD_Intercept
#> result.1 -5.289170 0.3643823 0.8327985 0.04166571 2.146418
#> result.2 -4.846403 0.3482698 1.1639233 0.03742744 2.013279
#> result.3 -5.686627 0.4883996 1.1610890 0.04873084 2.282471
#> result.4 -5.314589 0.5304110 0.4748585 0.05028079 1.749130
#> result.5 -4.929320 0.4025891 0.7537746 0.04008618 2.125053
#> result.6 -5.437674 0.3032833 1.2010048 0.04944755 2.106158
#> result.7 -4.849634 0.4087906 0.7465538 0.04108251 1.968190
#> result.8 -4.679774 0.3294246 0.8865826 0.03964922 1.941434
#> result.9 -4.916852 0.5016426 1.3680115 0.03248808 1.903482
#> result.10 -5.738815 0.5238406 1.3055919 0.04979450 2.026464
#> result.11 -4.741067 0.5376915 1.3995445 0.03157780 2.005948
#> result.12 -5.170877 0.4661977 0.8423246 0.04074828 1.907134
#> result.13 -5.764675 0.3938994 1.2536595 0.04590645 2.312255
#> result.14 -4.950653 0.3856612 1.0987770 0.04235045 1.748887
#> result.15 -5.565607 0.4498325 0.7832543 0.04278784 2.072407
#> result.16 -4.662915 0.4997881 0.8660844 0.03859824 1.848504
#> result.17 -4.489500 0.2233654 0.7963400 0.03878703 1.848505
#> result.18 -5.143580 0.2945519 0.7443318 0.04577832 2.072113
#> result.19 -4.848514 0.4045460 1.3158423 0.03454787 2.079658
#> result.20 -5.426354 0.4683027 1.4361239 0.03905594 2.174090
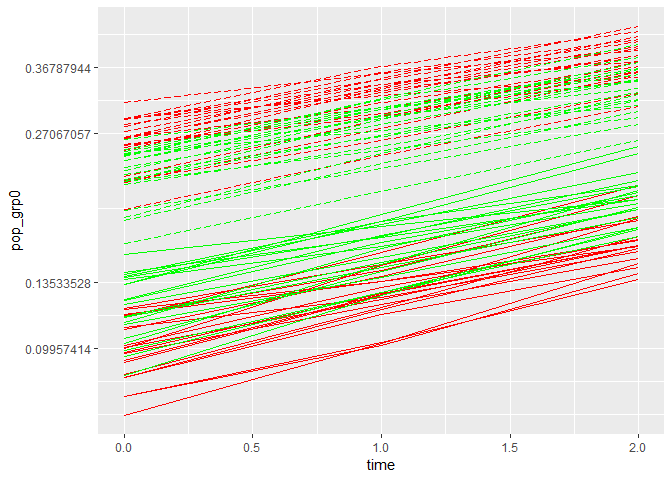
plotdat1 <- extract_plotdat(mods_scenario1,simresponse1)
ggplot(plotdat1,aes(y=pop_grp0,x=time,group=simindex)) +
geom_line(color='red',linetype=1) +
geom_line(aes(y=pop_grp1,x=time,group=simindex),color='red',linetype=5) +
geom_line(aes(y=cf_grp0,x=time,group=simindex),color='green',linetype=1) +
geom_line(aes(y=cf_grp1,x=time,group=simindex),color='green',linetype=5) +
scale_y_continuous(trans="log")
Created on 2019-01-17 by the reprex package (v0.2.1)