A minor iteration on @kmprioli’s answer: if you create the errorbar layer first, then it will appear behind the boxplot layer:
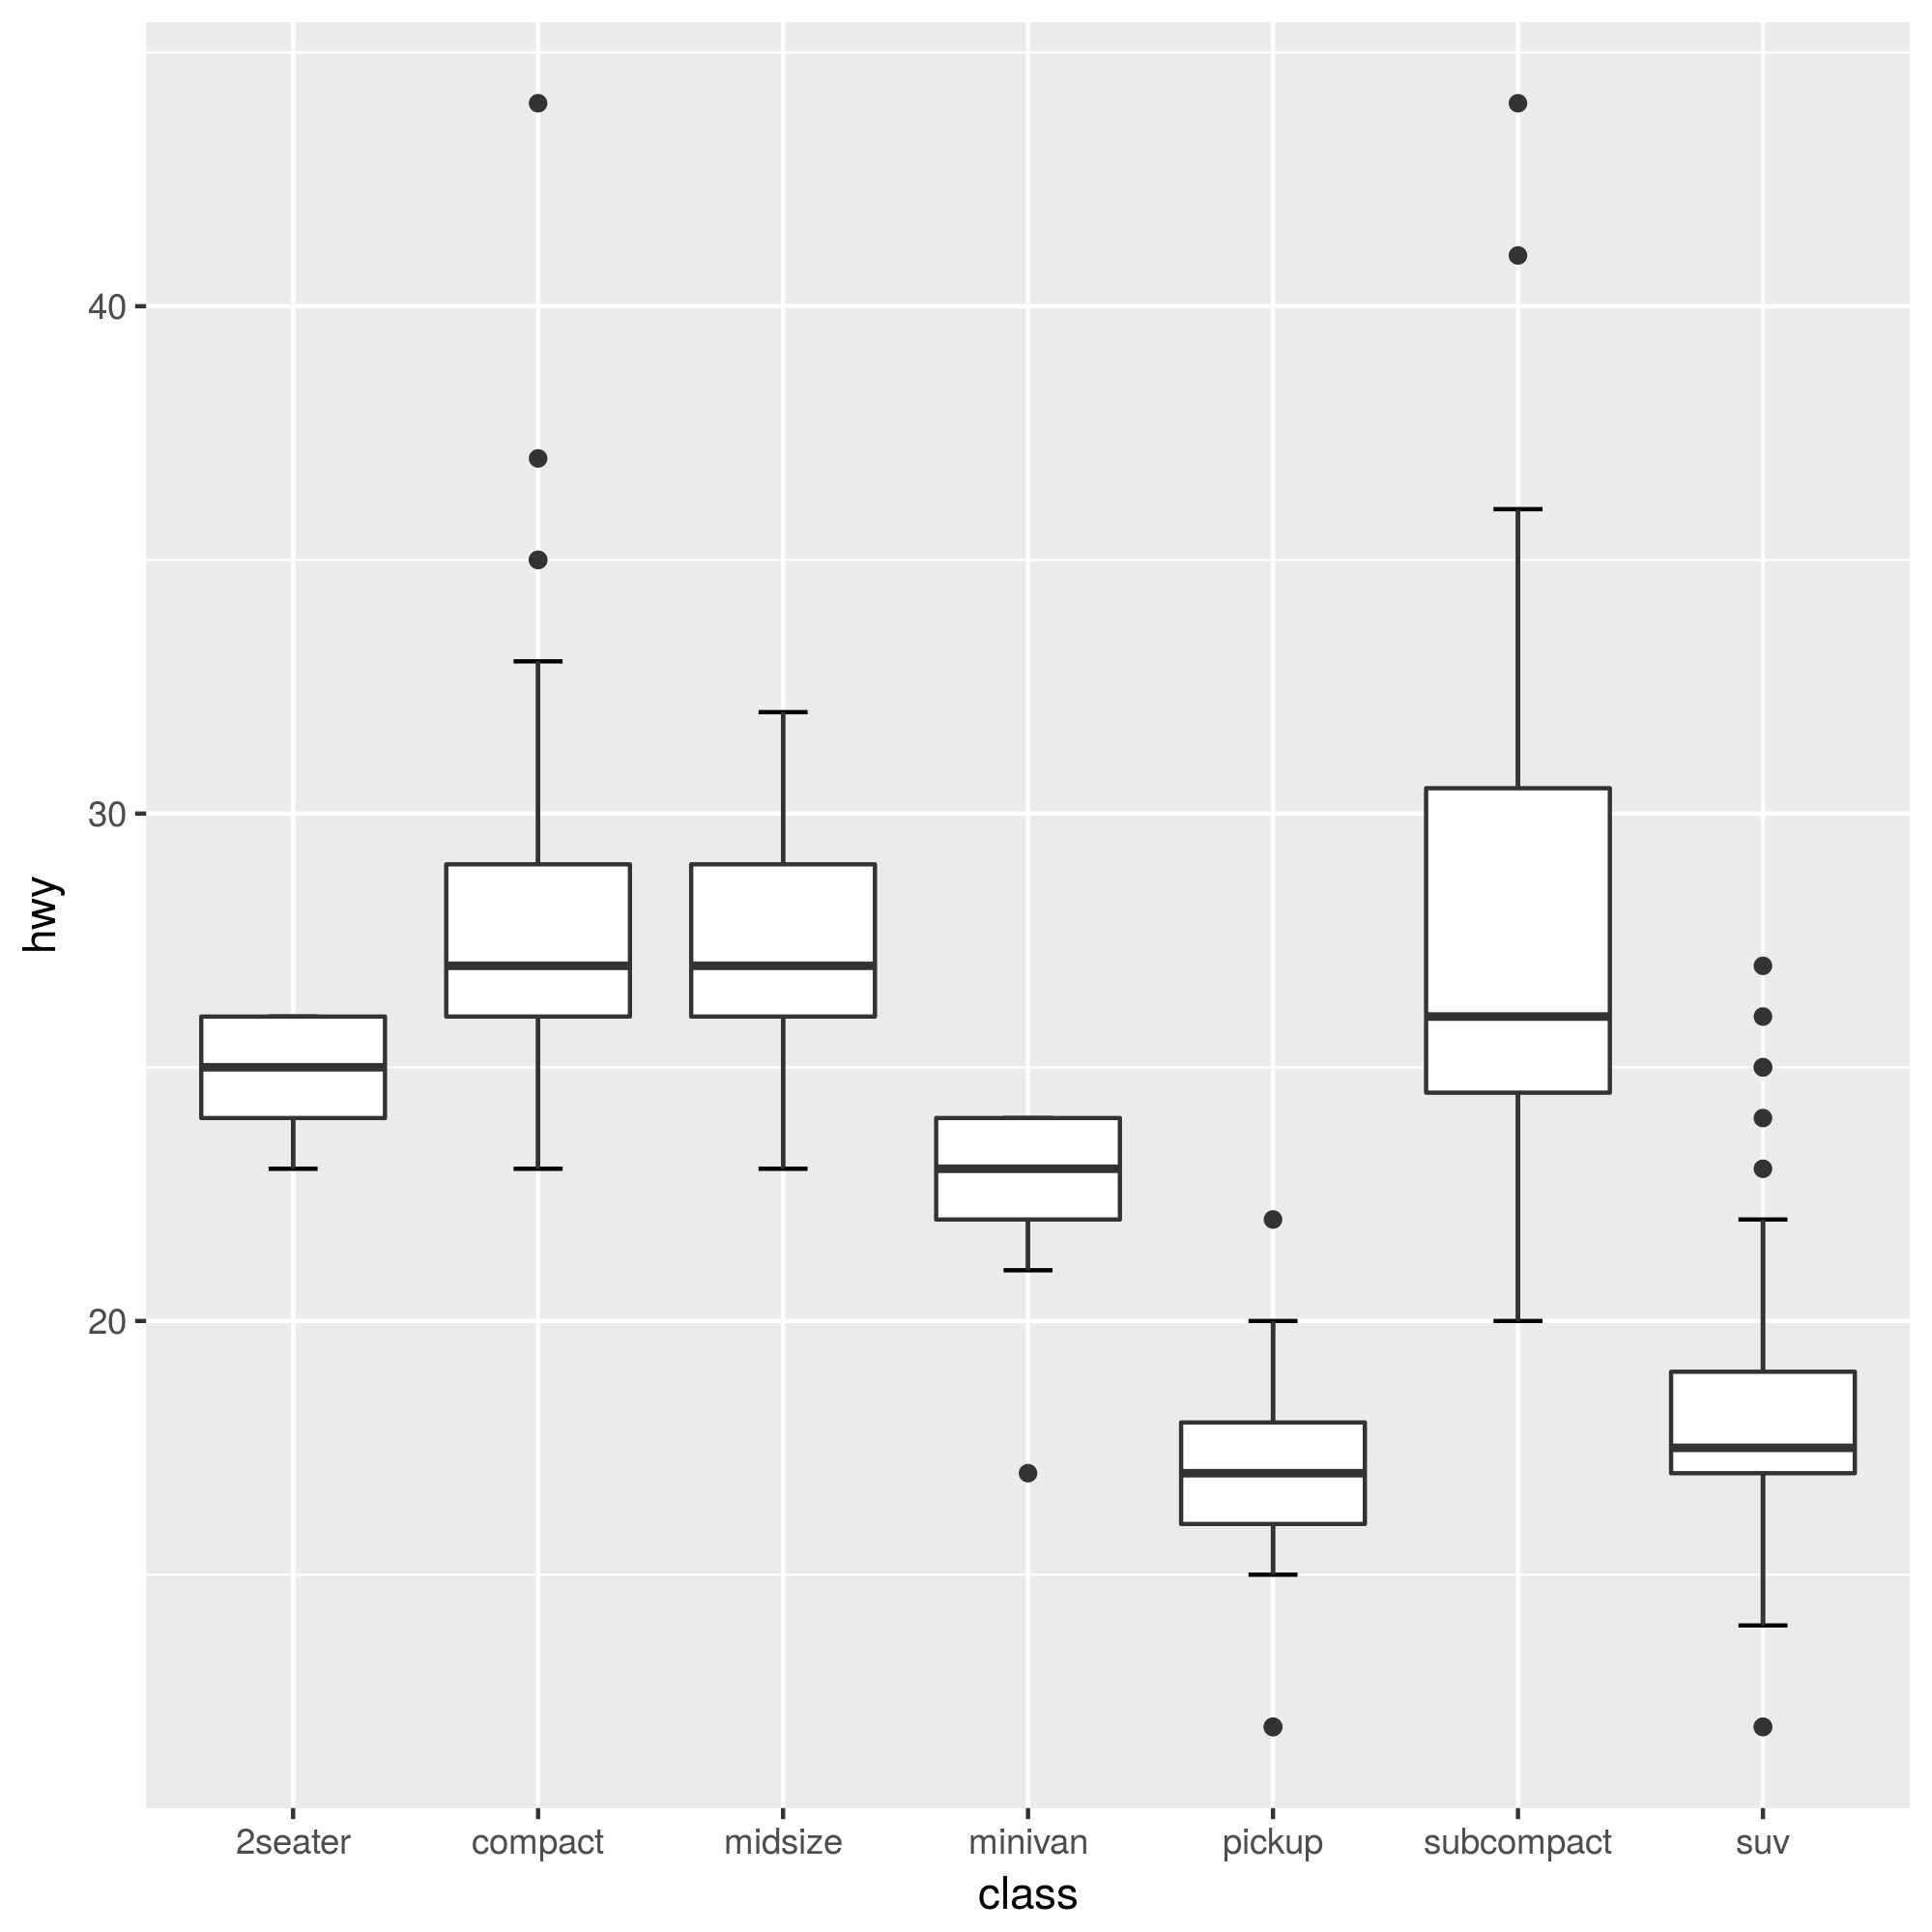
ggplot(data=mpg, mapping=aes(x=class, y=hwy)) +
  stat_boxplot(geom = "errorbar", width = 0.2) +
  geom_boxplot()
As a note, the “whiskers” are traditionally the vertical lines. The crossbars may or may not be present (they weren’t included Tukey’s original design, see Box-and-Whisker Plot -- from Wolfram MathWorld).