Hi, I tried to recreate this plot in ggplot:
x1 <- seq(5.001, 20, by = 0.001)

x3 <- seq(0, 20, by = 0.001)

x2 <- seq(5, 20, by = 0.01)

x <- rgamma(1000, scale = 1, shape = 2.3)

d <- c(x+max(x), max(x)-x)

ggplot(d1, aes(d)) + stat_ecdf(geom = "line", color = "blue", size=0.5) + xlim(5, 20) +
  ggplot(x3,aes(x2)) +
stat_function(fun = pnorm, args = list(mean=mean(d), sd=sqrt(var(d)))) + ylab("Fn(x)")
But what I have accomplished was two separate ggplots.
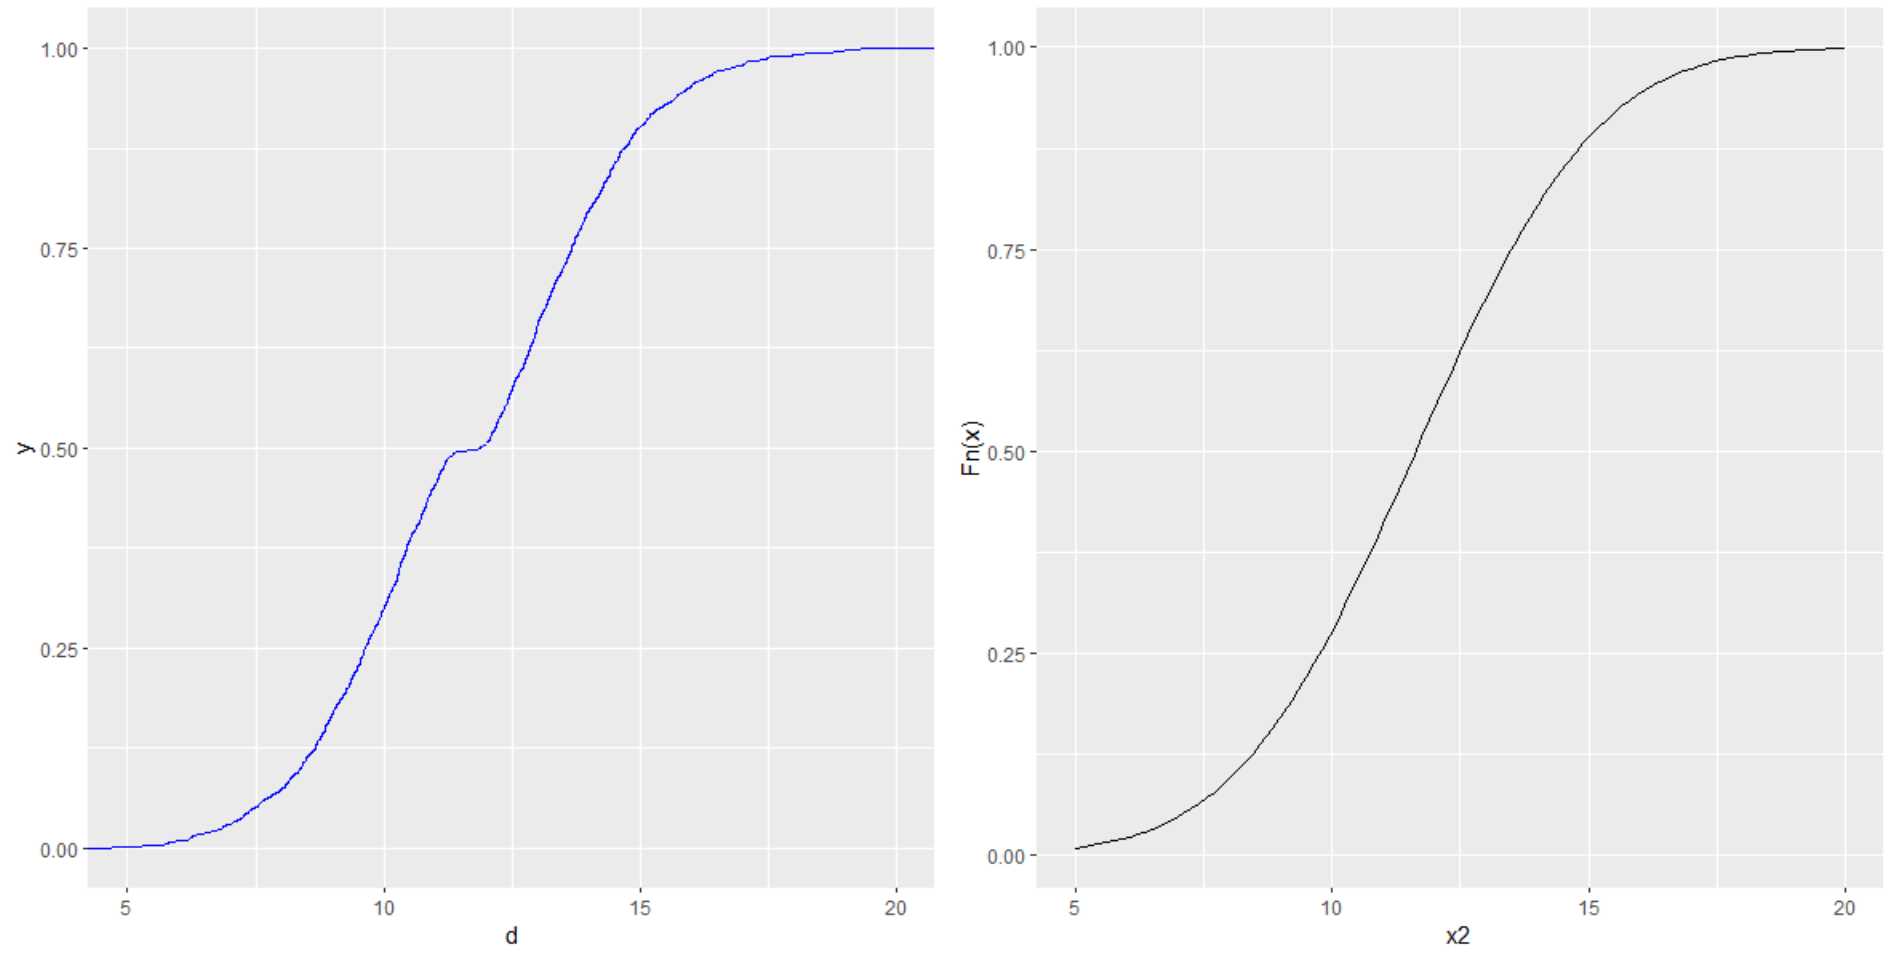
When I tried to do it on a single plot I kept receiving errors. How to superimpose these plots or melt them to one plot ? In other words how to draw two eCDFs (actually one eCDF and one CDF) on a single plot ?
Any help will be greatly appreciated.