See the FAQ: How to do a minimal reproducible example reprex for beginners.
Here's one approach
dat <- data.frame(v1 = sample(1:24,100,replace = TRUE),
v2 = sample(0:130,100,replace = TRUE),
v3 = sample(0:20000,100,replace = TRUE))
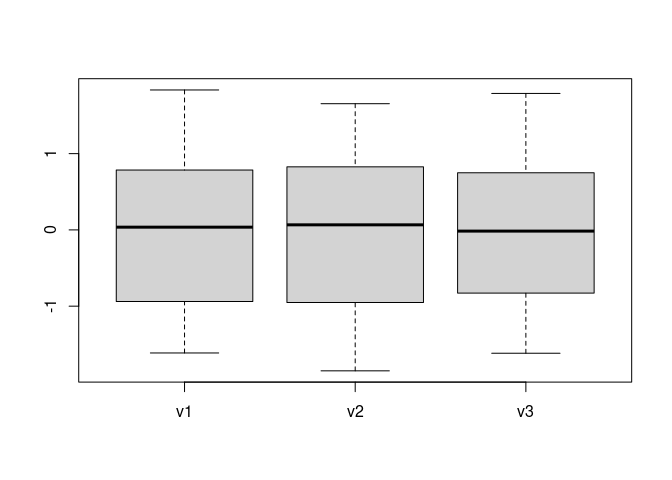
scaled <- scale(dat)
boxplot(scaled)