Dear, I got. @andresrcs has mentioned about the library 'reshape', and I have seen that library 'tidyr' is an appremorated version. Look below my code:
#install.packages('tidyr')
library(tidyr)
library(ggplot2)
help(tidyr)
original_spectro <- read.table(file='medias_p1ap4.txt',
header = TRUE)
os2 <- tidyr::gather(original_spectro, key = "Point", value = "Reflectance", Point_1, Point_2, Point_3, Point_4)
os2
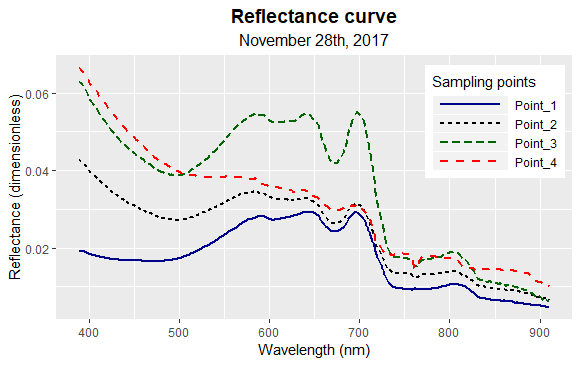
ggplot()+
geom_line(data=os2, aes(x=Comprimento_de_onda_nm, y=Reflectance, linetype = Point, color = Point), size = 1) +
xlab('Wavelength (nm)')+ylab('Reflectance (dimensionless)')+
ggtitle("Reflectance curve", subtitle = "November 28th, 2017")+
theme(
plot.title=element_text(hjust=0.5, face='bold', size = 14),
plot.subtitle = element_text(hjust=0.5, size = 12)
)+
theme(legend.key.width=unit(2,"cm"),legend.key.height=unit(0.5,"cm"),
legend.position = c(0.85, 0.75))+
scale_colour_manual(values = c("darkblue", "black", "darkgreen", "red"))+
labs(linetype="Sampling points", colour="Sampling points")
ggsave("original_spectro.jpeg", width = 15, height = 10, units = "cm", dpi = 1500)
Thank you guys! You two have soluctioned my problem!