Below is one way to achieve this using a checkboxInput.
ui <- fluidPage(
sidebarLayout(
sidebarPanel(
selectInput("thegene", "Gene", choices = c("BRCA1", "BRCA2", "BRCA3"), selected = "BRCA1"),
radioButtons("colour","Colour of histogram",choices=c("red","green","blue"),selected="red"),
selectInput('type', 'Select one', choices = c('tissue', 'metastasis'), selected = 'tissue'),
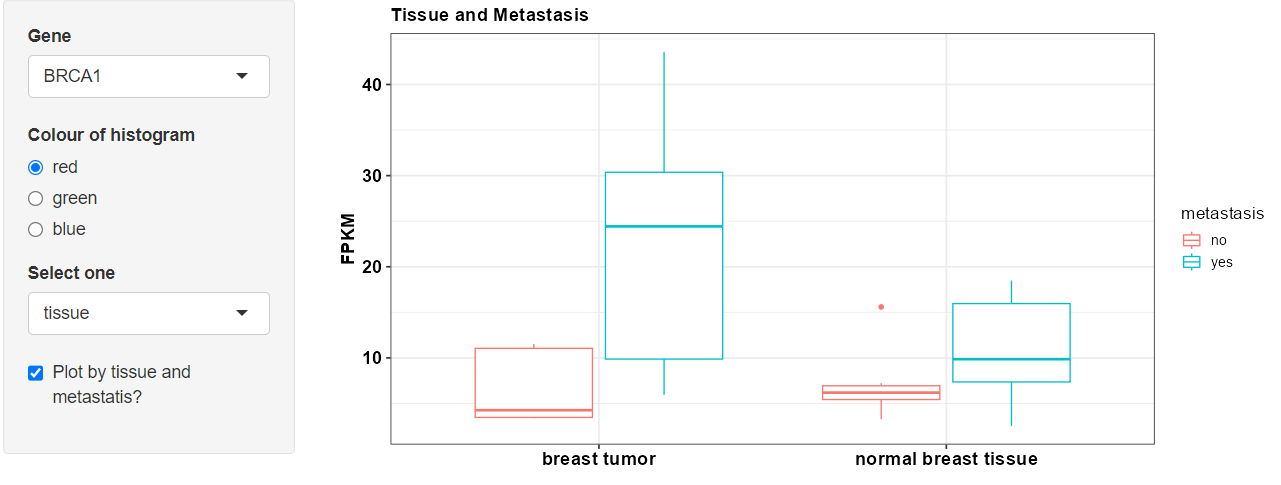
checkboxInput('plotby', 'Plot by tissue and metastatis?', value = F),
width = 3
),
mainPanel(
plotOutput("boxplot"),
width = 9
)
)
)
server <- function(input, output, session) {
dat <- reactive({
if(input$plotby == F) {
custom_data |>
filter(gene == input$thegene) |>
pivot_longer(cols = c('tissue', 'metastasis'), names_to = 'type') |>
filter(type == input$type)
} else {
custom_data |>
filter(gene == input$thegene) |>
mutate(value = tissue)
}
})
output$boxplot <- renderPlot({
g = ggplot(data = dat(), aes(x = value, y = FPKM, fill = gene)) +
scale_fill_manual(values = input$colour)
Title = str_to_title(input$type)
if(input$plotby == T) {
g = ggplot(data = dat(), aes(x = value, y = FPKM, color = metastasis))
Title = 'Tissue and Metastasis'
}
g +
geom_boxplot() +
theme_bw(base_size = 14) +
labs(x = "", y = "FPKM", title = Title) +
theme(axis.text=element_text(size=15, face = "bold", color = "black"),
axis.title=element_text(size=15, face = "bold", color = "black"),
plot.title = element_text(size=15, face = "bold", color = "black"))
})
}
shinyApp(ui = ui, server = server)