please use the reprex package and add in I do not have access to your file system to browse to your file
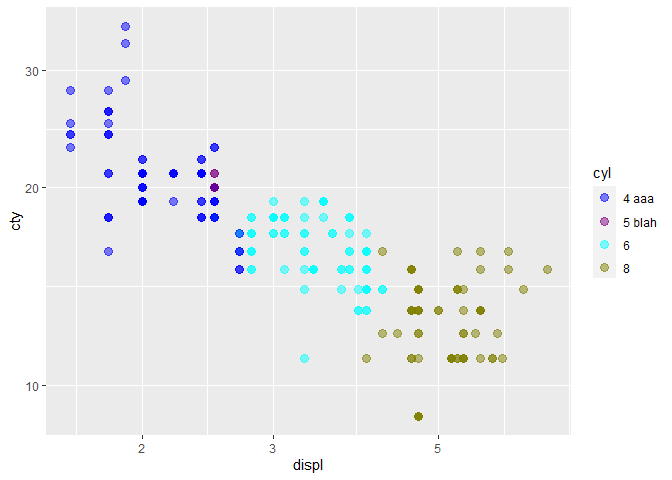
library(ggplot2)
mpg$cyl <-as.factor(mpg$cyl)
  ggplot(mpg,aes(x = displ  , y = cty)) +
  geom_point(aes(color = cyl),size=3, alpha=0.5) +
  scale_y_continuous(trans='log10') +
  scale_x_continuous(trans='log10') +
  scale_color_manual(labels=c(
    "4 aaa",
    "5 blah",
    "6",
    "8"),
    values=c(
      "#0000FF",
      "#800080",
      "#00FFFF",
      "#808000" )) +
  theme_gray() +
  theme(axis.title = element_text())
Created on 2021-02-22 by the reprex package (v1.0.0)