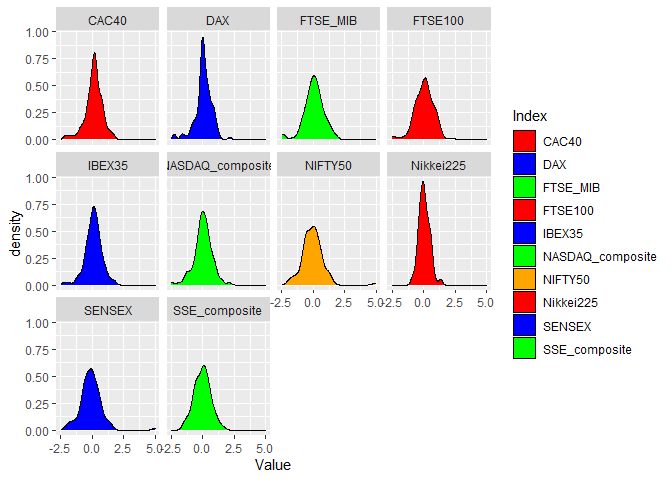
I would use the facet_wrap function in ggplot2.
DF <- read.csv("~/R/Play/Dummy.csv")
library(tidyr)
library(ggplot2)

DFlong <- pivot_longer(DF, -date, names_to = "Index", values_to = "Value")
COLORS <- c(CAC40 = "red", DAX = "blue", FTSE_MIB = "green", FTSE100 = "red",
            IBEX35 = "blue", NASDAQ_composite = "green", Nikkei225 = "red",
            SENSEX = "blue", SSE_composite = "green", NIFTY50 = "orange")

ggplot(DFlong, aes(Value, fill = Index)) + geom_density() +
  scale_fill_manual(values = COLORS) +
  facet_wrap(~Index)
#> Warning: Removed 3 rows containing non-finite values (stat_density).
Created on 2020-08-09 by the reprex package (v0.3.0)