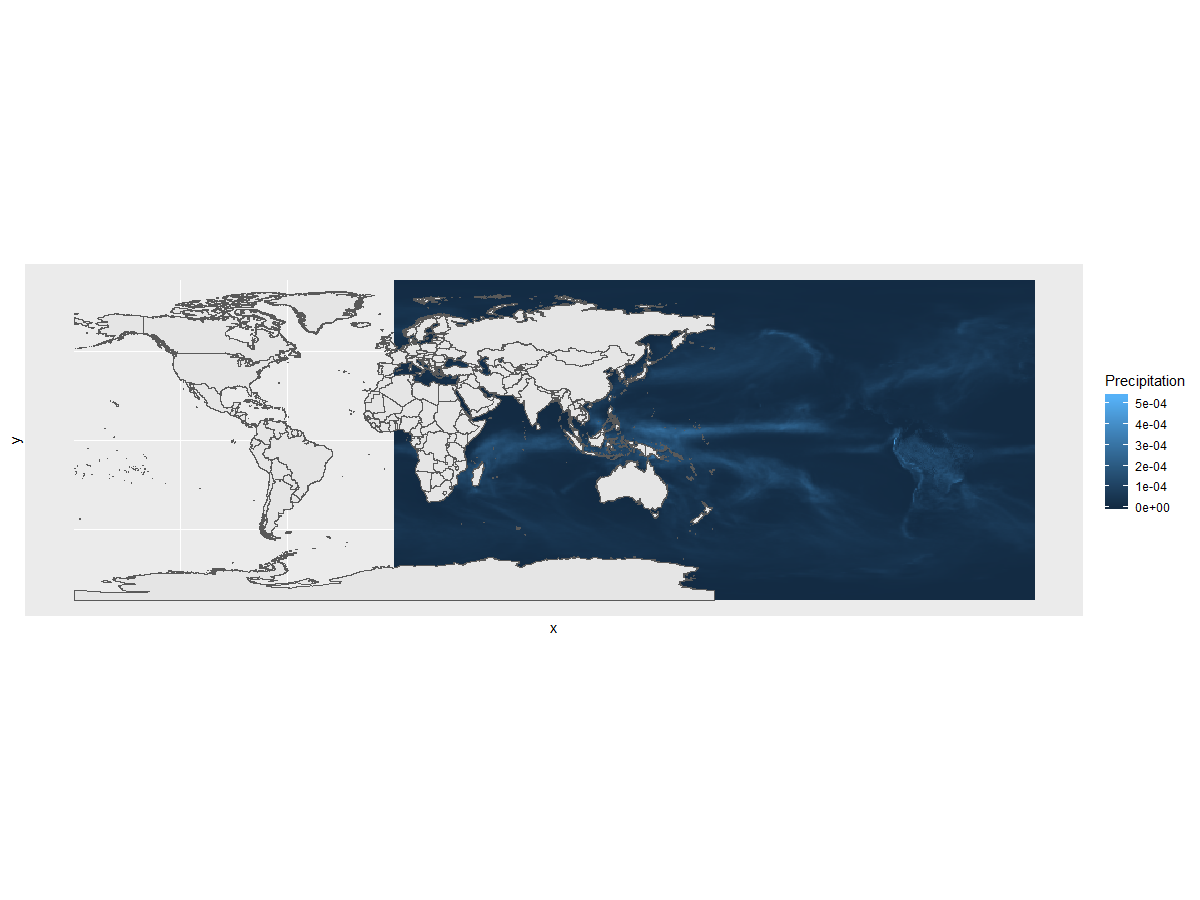
Hmm, I was able to get the shapefile but when I map it, it looks like this. Do you know what's going on? Also, is there a way to just have the lines for the countries?
I am getting an error when trying to set the boundaries as well:
#Crop to bounding box (insert coordinates in ...)
bb <- sf::st_bbox(xmin = -171.791110603, xmax = -66.96466, ymin = 18.91619, ymax = 71.3577635769)
stars_object <- stars_object[bb]
Error in is.numeric(bb) && length(bb) == 4 :
  argument "obj" is missing, with no default
My code:
install.packages("stars")
library(sf)
library(ggplot2)
library(stars)
library(dplyr)

stars_object <- raster::raster("pr_Amon_EC-Earth3_historical_r1i1p1f1_gr_199801-199812.nc") %>% st_as_stars()
sf_object <- sf::st_read("countries.shp")

#Make sure they have the same CRS
sf::st_crs(stars_object) <- sf::st_crs(sf_object)

#U.S. 'US': ('United States', (-171.791110603, 18.91619, -66.96466, 71.3577635769))
#Crop to bounding box (insert coordinates in ...)
bb <- sf::st_bbox(xmin = -171.791110603, xmax = -66.96466, ymin = 18.91619, ymax = 71.3577635769)
stars_object <- stars_object[bb]

#plot
ggplot()+
  geom_stars(data = stars_object) +
  geom_sf(data = sf_object)