Glad it worked!
I was suspecting that some of the problem with plotting the predictions had to do with the limited range of x. Often in this case, making predictions for a longer sequence could help. This is actually what geom_smooth() does under the hood when it makes predicted lines for you.
The expand.grid() is useful for making a prediction dataset with a new x as well as the character variables. You can see I make a longer sequence of numeric x and repeat it for every group and every sex. I had to be careful to first convert x to numeric for making the sequence, which I made from the minimum to the maximum value with a total of 50 values, and then making it a character.
When making predictions with a new dataset, all variables in the right-hand side of the model must be in the dataset.
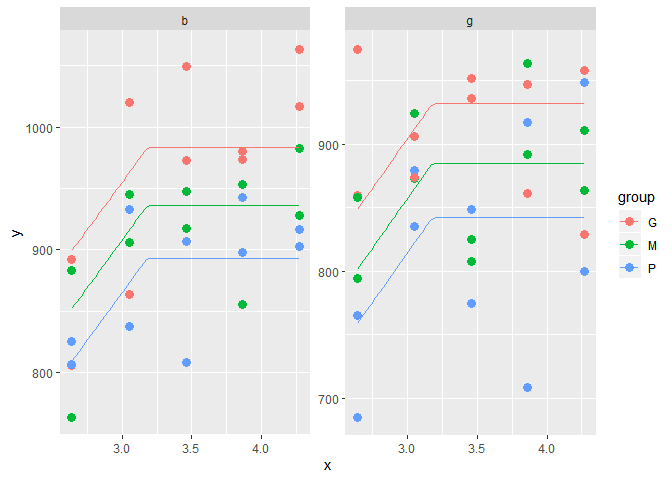
The plot is done using geom_line() with data = newdat. The result looks better to me than the one made using the original dataset for predictions.
model.nls_plat = nls(y ~ ifelse(as.numeric(x) < 3.18,
                                a + b *(3.18 - as.numeric(x)), a) +
                          b1*(group=="M") + b2*(group=="G") + b3*(sex=="g"),
                     data=dat,
                     start = c(a=870, b=-150,b1=-47,b2=-90,b3=-51),
                     control = list(maxiter=50) )

newdat = expand.grid(x = seq(min( as.numeric(dat$x) ),
                             max( as.numeric(dat$x) ), length.out = 50),
                     group = unique(dat$group),
                     sex = unique(dat$sex) )
newdat$x = as.character(newdat$x)

# Make predictions using the longer dataset
newdat$pred.nls = predict(model.nls_plat, newdata = newdat)

ggplot(dat, aes(as.numeric(x), y, fill = group, color = group)) +
     geom_point(shape = 21, size = 3) +
     xlab("x")  +
     ylab("y") +
     geom_line(data = newdat, aes(y = pred.nls) ) +
     facet_wrap(~sex, scales = "free_y")
Created on 2020-01-10 by the reprex package (v0.2.0).