Glad to be of service; spatial analysis is fun!
The Pakistan labels kind of remind me of the results produced by GEODA; you can use it via the {rgeoda} package, directly from the guys in Chicago / Luc Anselin's lab.
Consider this code:
library(sf)
library(rgeoda)
library(ggplot2)

shape <- st_read(system.file("shape/nc.shp", package="sf")) # included with sf package

# create weights object
queen_w <- queen_weights(shape)

# calculate LISA as per GEODA
lisa <- local_moran(queen_w, shape["SID79"]) # or any other variable :)

# process results
shape$cluster <- as.factor(lisa$GetClusterIndicators())
levels(shape$cluster) <- lisa$GetLabels()

# A visual overview
ggplot(data = shape) +
  geom_sf(aes(fill = cluster))
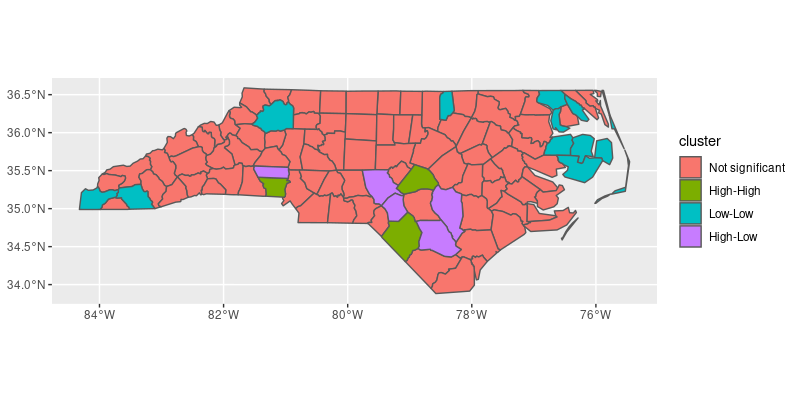
You would want to tune the fill palette a bit, but that is standard ggplot stuff...
I raise an imaginary beer glass from Prague, in a general south westerly direction ![]()
J.