See the FAQ: How to do a minimal reproducible example reprex for beginners. Here is an example based on an assumed dataset.
suppressPackageStartupMessages({
library(ggplot2)
})
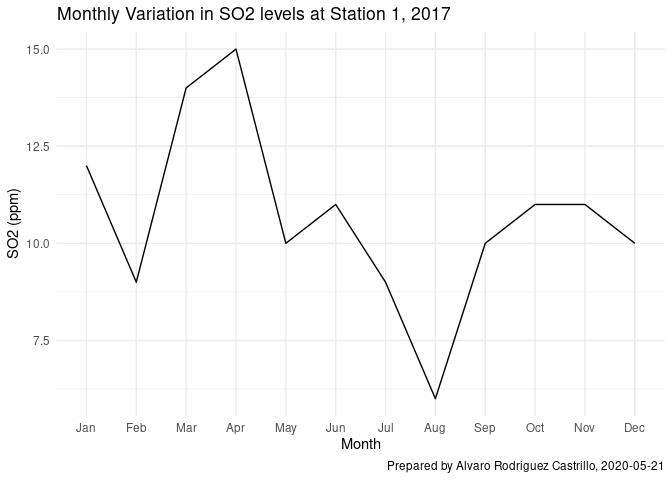
dat <- data.frame(x = 1:12,
y = c(12,9,14,15,10,11,9,6,10,11,11,10))
p <- ggplot(dat,aes(x,y))
p +
geom_line() +
scale_x_discrete(limits = 1:12, labels = month.abb) +
labs(title = "Monthly Variation in SO2 levels at Station 1, 2017",
caption ="Prepared by Alvaro Rodriguez Castrillo, 2020-05-21") +
xlab("Month") +
ylab("SO2 (ppm)") +
theme_minimal()
#> Warning: Continuous limits supplied to discrete scale.
#> Did you mean `limits = factor(...)` or `scale_*_continuous()`?