It would be tricky to reproduce your image one to one - but this piece of code should give you a start.
library(sf) # spatial data manipulation
library(dplyr) # general data frame manipulation
library(ggplot2) # ...because ggplot :)
library(giscoR) # spatial data from Eurostat

# countries of the world as a sf data frame
countries <- giscoR::gisco_get_countries(resolution = "10")

# area of interest - bottom left & top right corner first, then a bounding box
aoi <- data.frame(lat = c(30, 75),
                  long = c(-15, 35)) %>%
  st_as_sf(coords = c("long", "lat"), crs = 4326) %>%
  st_bbox() %>%
  st_as_sfc() %>%
  st_segmentize(units::set_units(1, degree)) %>%
  st_transform(3035) # European Albers - a conical projection is  a must here

# cut countries to size
countries_in_view <- countries %>%
  st_transform(3035) %>%
  st_intersection(aoi)

# now the action!
ggplot() +
  geom_sf(data = aoi, fill = "gray70") + # first the background
  geom_sf(data = countries_in_view, fill = "white") + # now the foreground
  theme_void() # no distractions please!
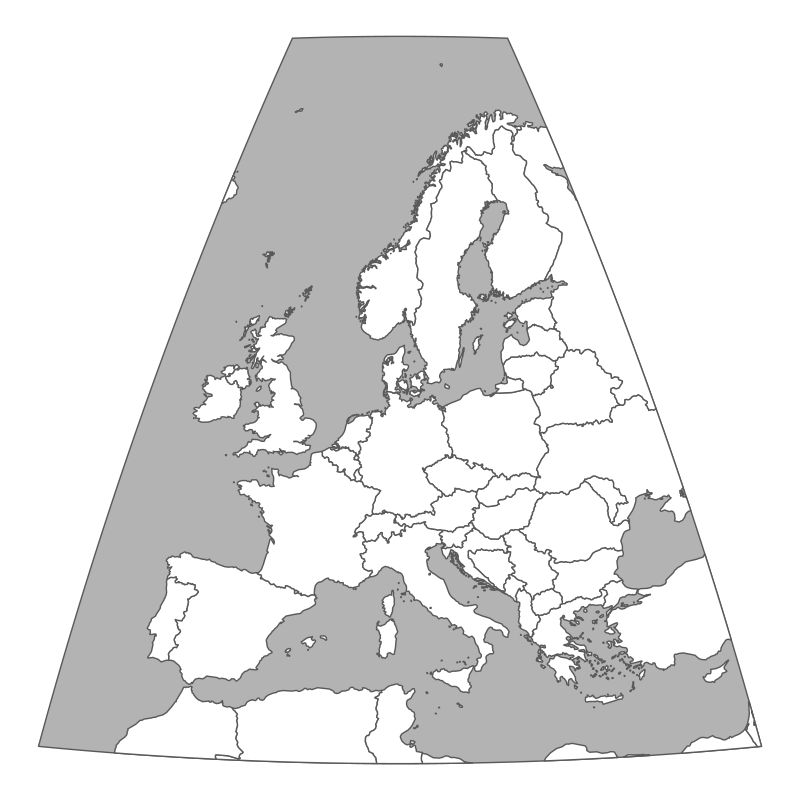
You will need to provide the code for the localities yourself, and I am unsure of how to approach the dotted areas (it is quite possible these were hand drawn on the finished map; but without any idea about the raw data this is just my speculation)