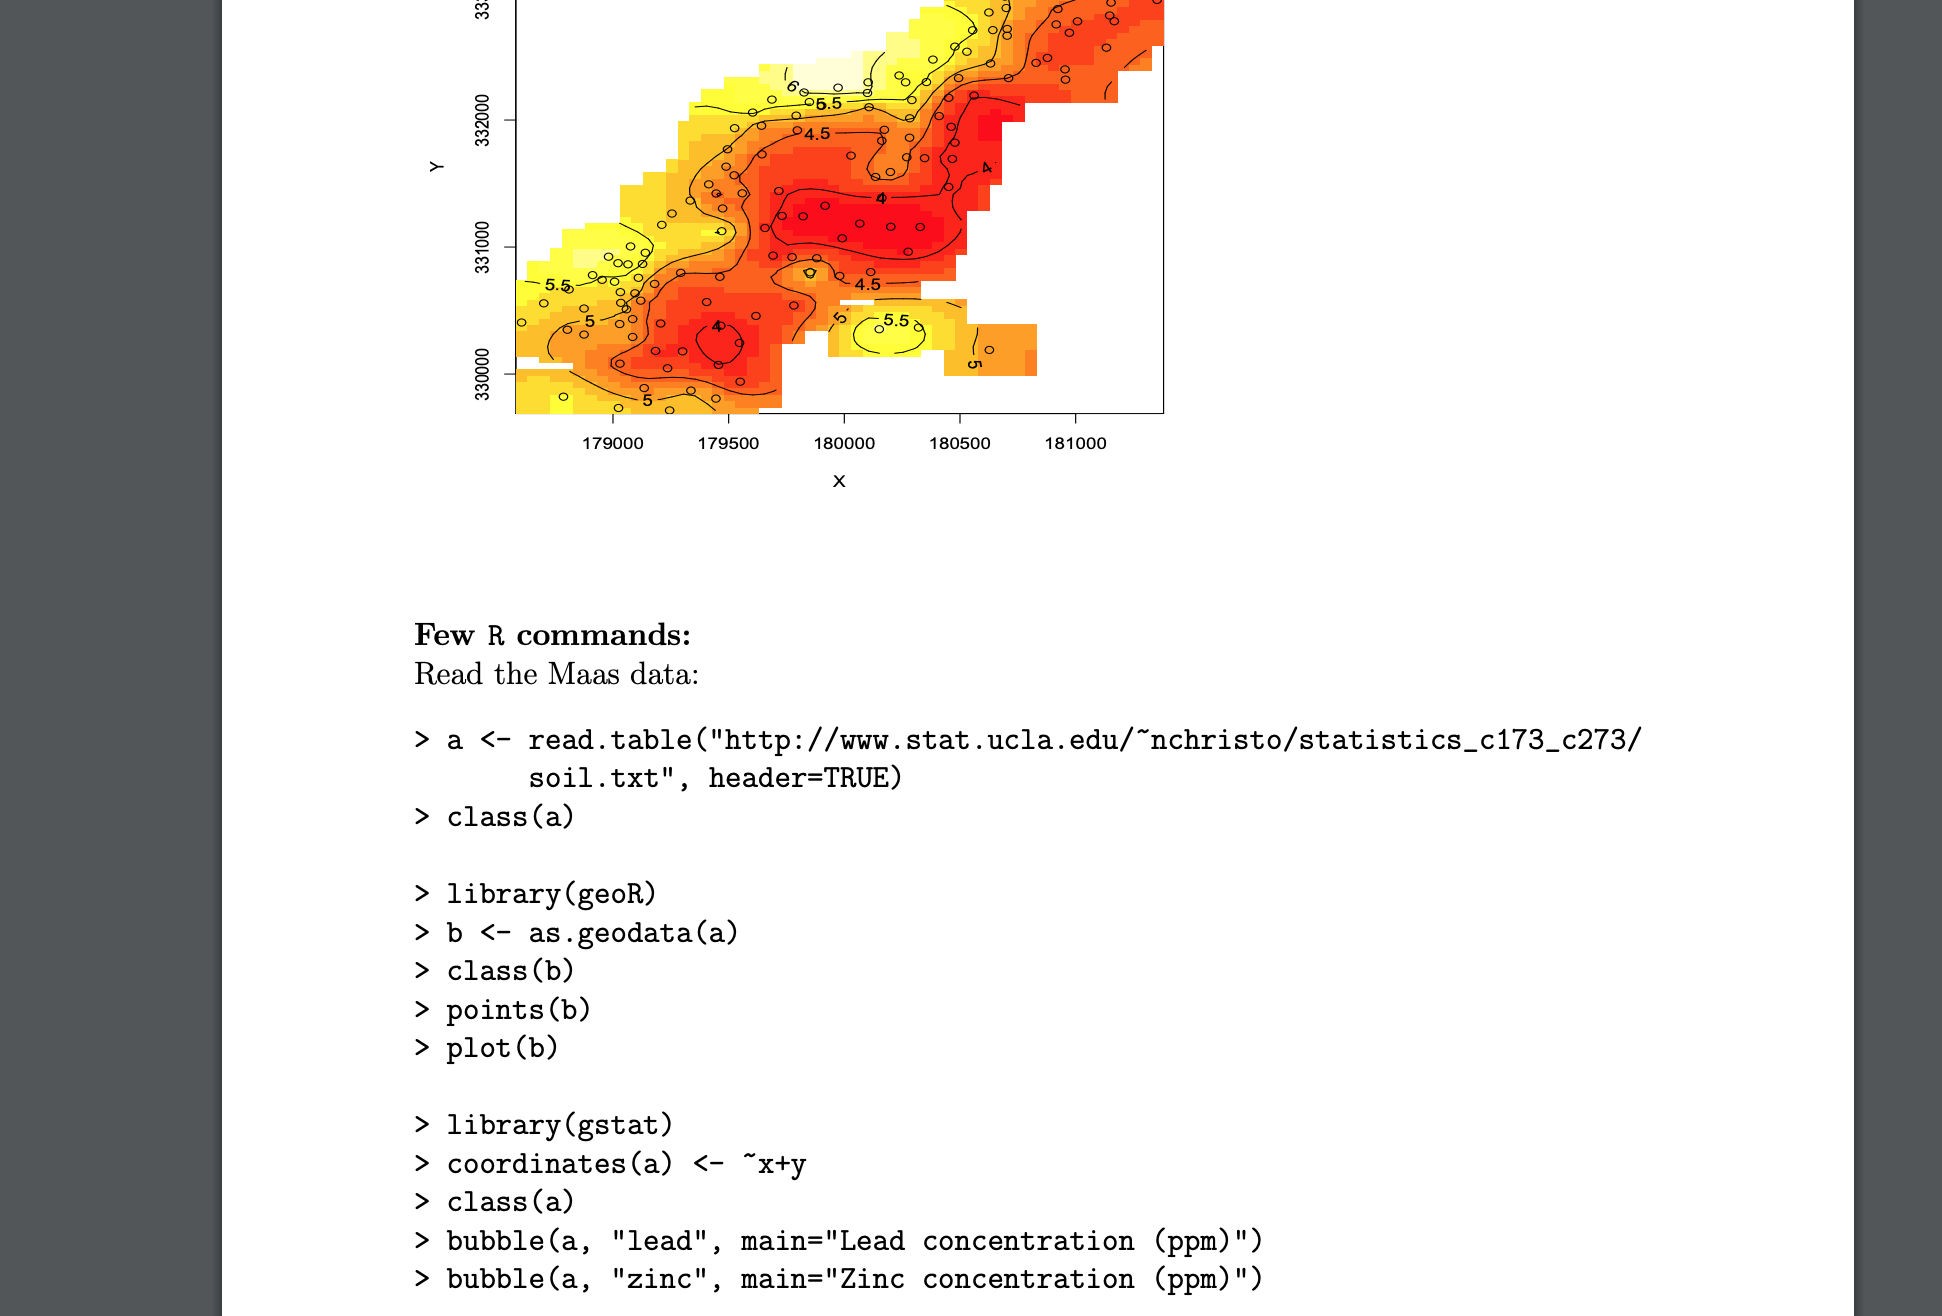
I have this in my worksheet:
library(gstat) coordinates(a) <- ~x+y class(a) bubble(a, "lead", main="Lead concentration (ppm)") bubble(a, "zinc", main="Zinc concentration (ppm)")
I'm attempting to replicate the R commands in the screenshot below: