assuming the example data you posted is called 'df'
library(tidyverse)
(df2 <- df %>% rowwise() %>%
mutate(densvec=list(rnorm(10000,Resultado,sd_Res))) %>%
select(Cod_participante,Parametro,densvec))
(df3 <- unnest(df2,cols=densvec))
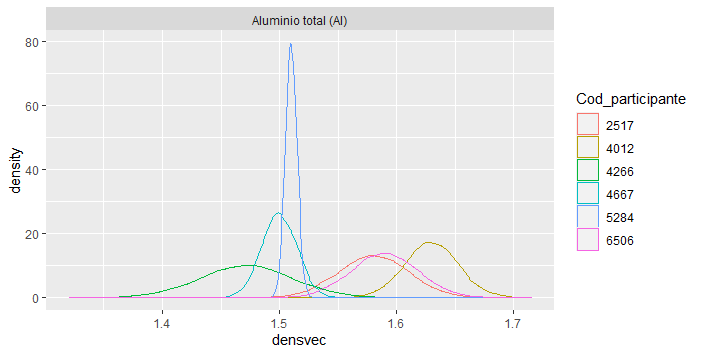
ggplot(df3,
aes(densvec,color=Cod_participante))+
geom_density() +
facet_wrap(~Parametro)