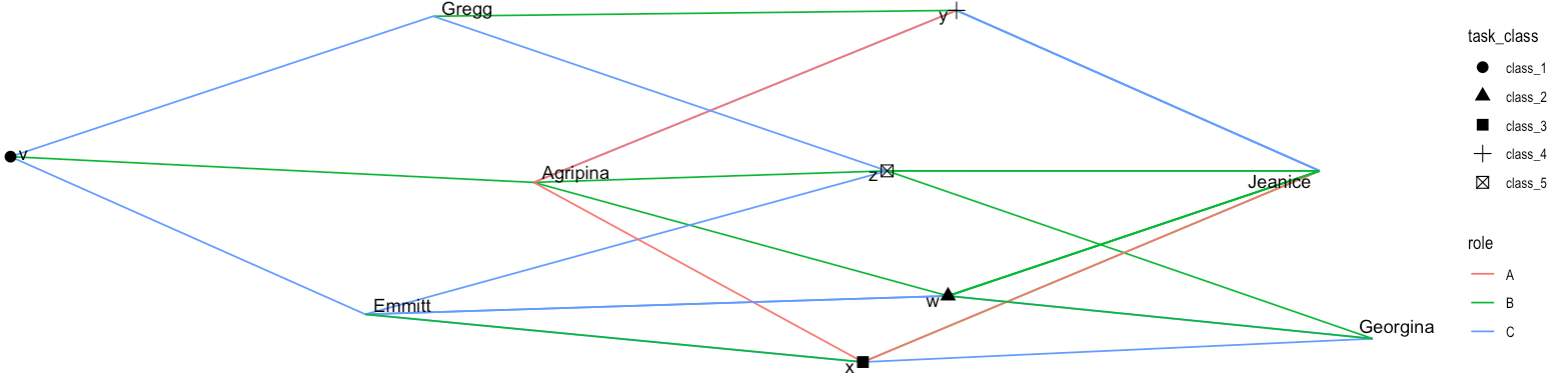
So thinking and testing, I think this is close to what I was trying to obtain:
# Load libraries ----------------------------------------------------------
library("tidyverse")
library("ggraph")
library("tidygraph")


# Define example data -----------------------------------------------------
set.seed(651906)
n <- 30
my_data <- tibble(
  person = sample(c("Georgina",
                    "Jeanice",
                    "Emmitt",
                    "Agripina",
                    "Gregg"),
                  size = n,
                  replace = TRUE),
  task = sample(letters[22:26],
                size = n,
                replace = TRUE),
  role = sample(LETTERS[1:3],
                size = n,
                replace = TRUE)) %>%
  mutate(task_class = case_when(task == "v" ~ "class_1",
                                task == "w" ~ "class_2",
                                task == "x" ~ "class_3",
                                task == "y" ~ "class_4",
                                task == "z" ~ "class_5"))


# Wrangle data ------------------------------------------------------------
my_data_graph <- my_data %>%
  as_tbl_graph %>%
  full_join(my_data %>%
              select(task, task_class) %>%
              distinct,
            by = c("name" = "task"))


# Create graph ------------------------------------------------------------
my_data_graph %>%
  ggraph(layout = "kk") +
  geom_edge_link(aes(edge_colour = role)) +
  geom_node_point(aes(shape = task_class), size = 3) +
  geom_node_text(aes(label = name),
                 repel = TRUE) +
  theme_graph() +
  scale_shape_discrete(na.translate = FALSE)
Yielding: