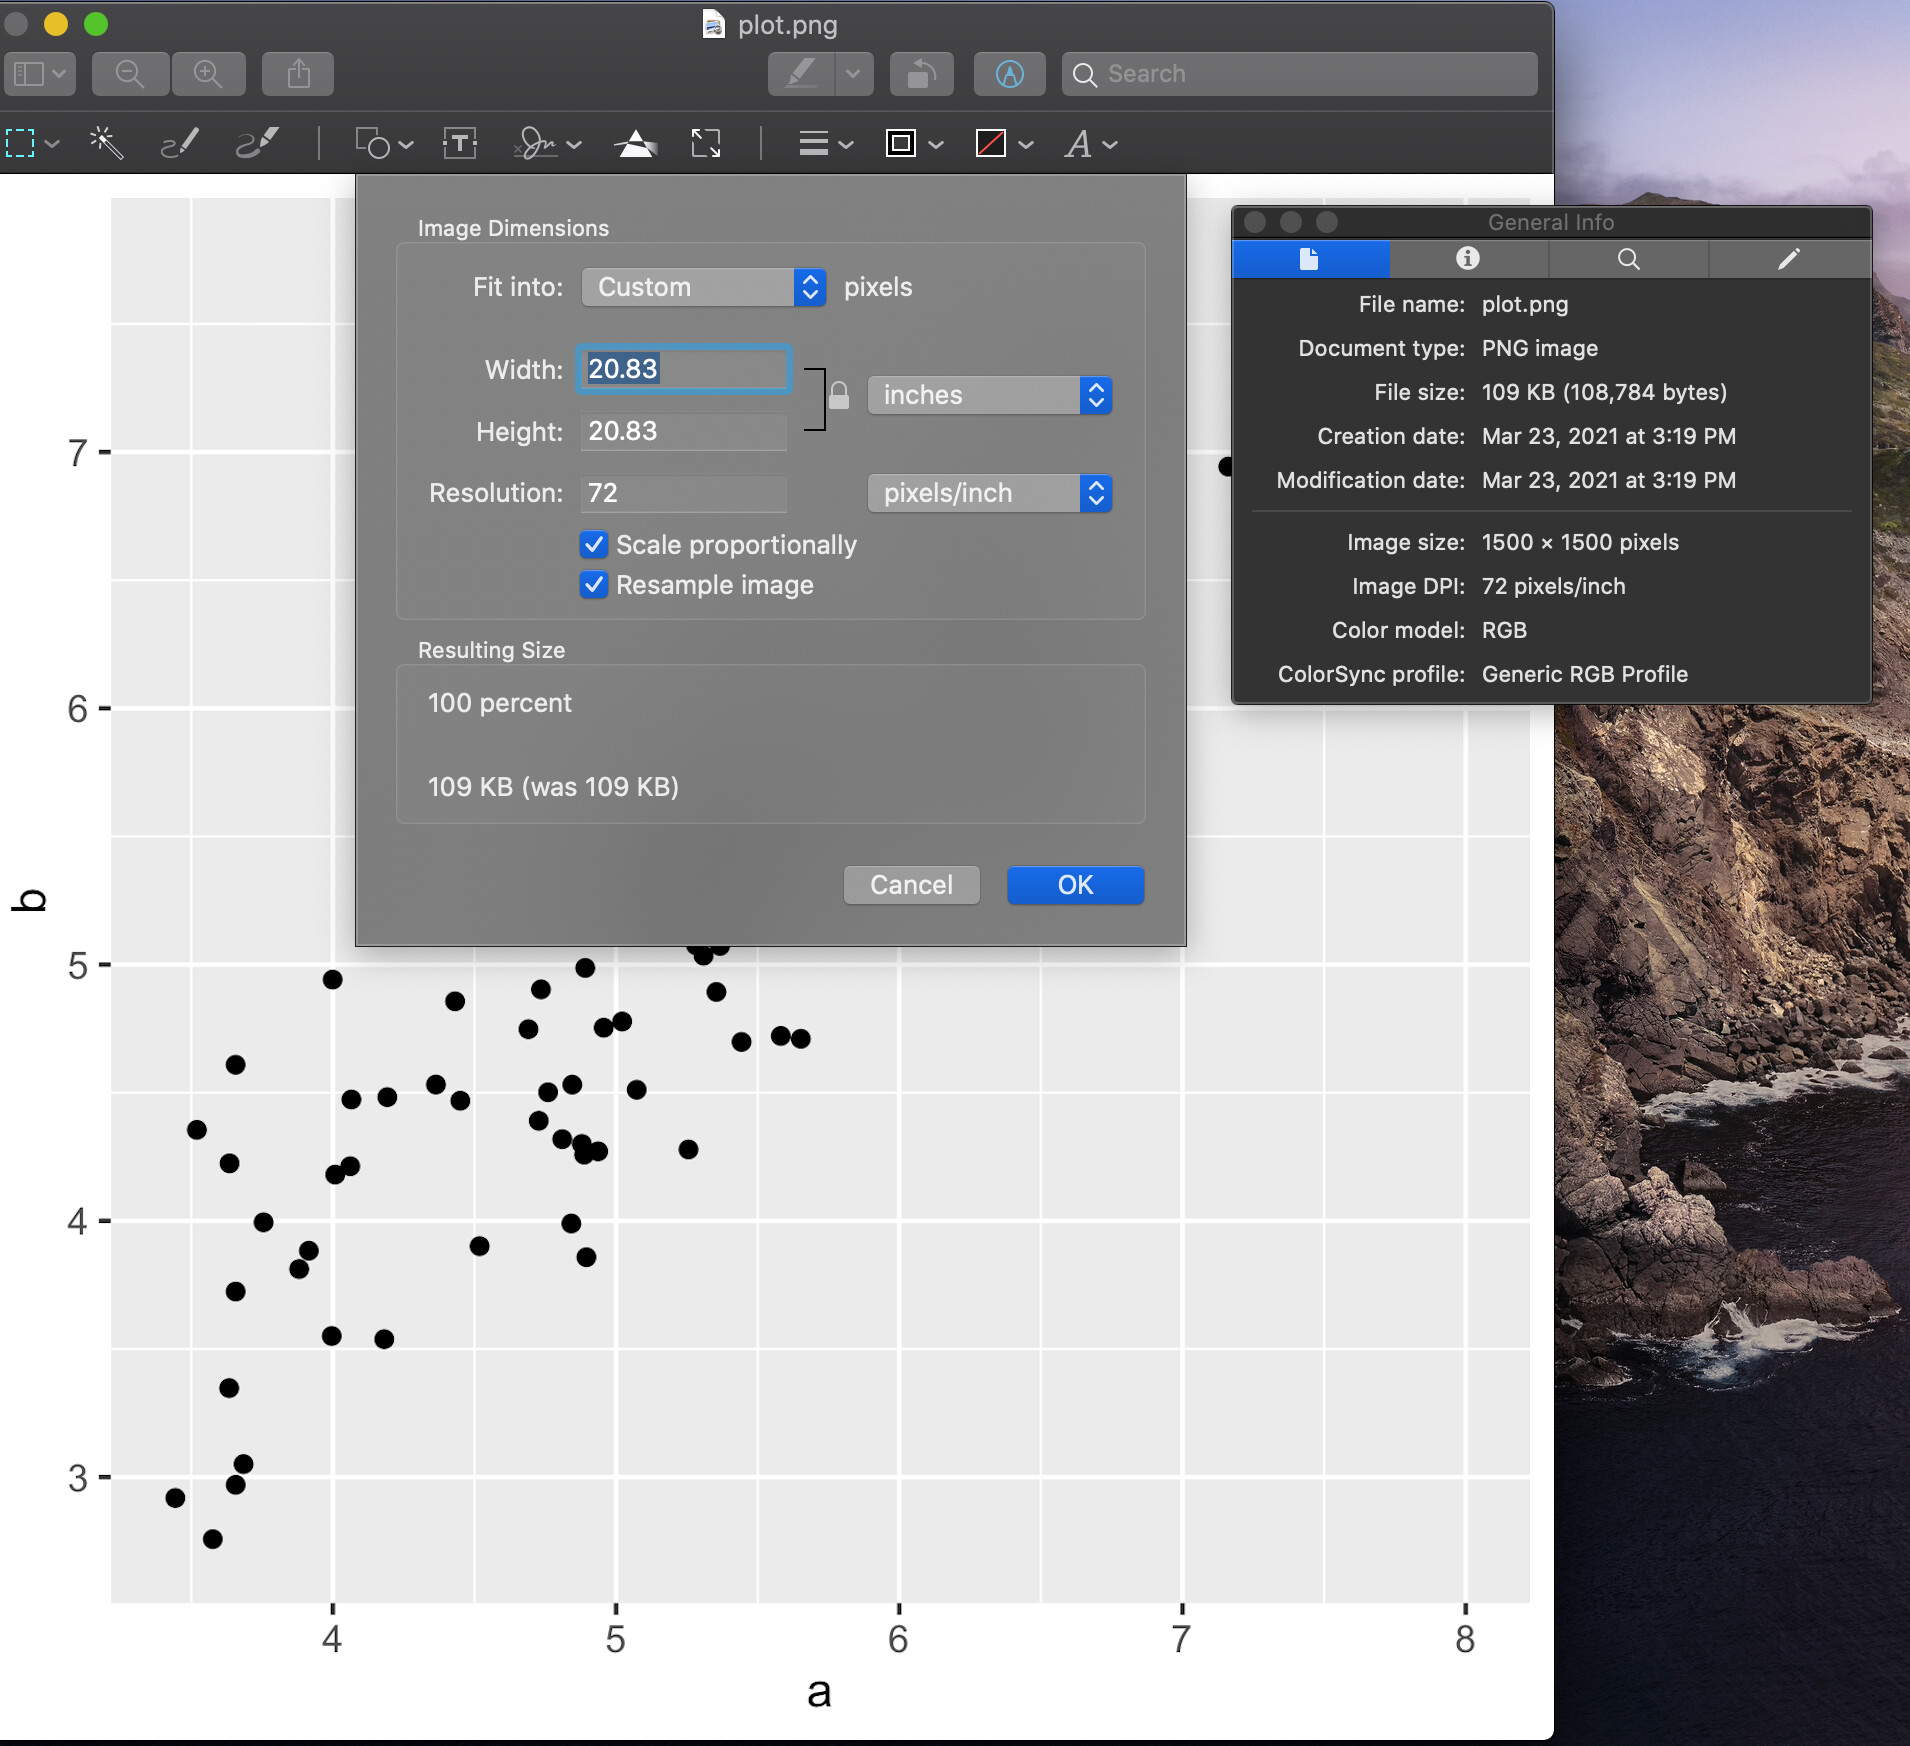
I am having trouble with saving publication-ready plots in ggplot2, or perhaps just don't understand how ggplot2/ggsave works. The following code saves a plot on my computer that is roughly 20"x20" with 72 dpi. I need to plot to be roughly 5"x5" with > 300 dpi.
Thank you!
library(tidyverse)

df <- tibble(
a = rnorm(100, 5, 1),
b = a + rnorm(100, 0, .5)
)

df %>%
  ggplot(aes(a, b)) +
  geom_point()

ggsave('plot.png', dpi = 300, height = 5, width = 5, unit = 'in')
sessionInfo()
# R version 4.0.3 (2020-10-10)
# Platform: x86_64-apple-darwin17.0 (64-bit)
# Running under: macOS Catalina 10.15.7
#


# Matrix products: default
# BLAS:   /System/Library/Frameworks/Accelerate.framework/Versions/A/Frameworks/vecLib.framework/Versions/A/libBLAS.dylib
# LAPACK: /Library/Frameworks/R.framework/Versions/4.0/Resources/lib/libRlapack.dylib
#
# locale:
# [1] en_US.UTF-8/en_US.UTF-8/en_US.UTF-8/C/en_US.UTF-8/en_US.UTF-8
#
# attached base packages:
# [1] stats     graphics  grDevices utils     datasets  methods   base
#
# other attached packages:
# [1] here_1.0.1         ggpmisc_0.3.8-1    RColorBrewer_1.1-2 GGally_2.1.0       forcats_0.5.1      stringr_1.4.0
# [7] dplyr_1.0.5        purrr_0.3.4        readr_1.4.0        tidyr_1.1.2        tibble_3.1.0       ggplot2_3.3.3
# [13] tidyverse_1.3.0
#
# loaded via a namespace (and not attached):
# [1] progress_1.2.2    tidyselect_1.1.0  haven_2.3.1       colorspace_2.0-0  vctrs_0.3.6       generics_0.1.0
# [7] yaml_2.2.1        utf8_1.1.4        rlang_0.4.10      pillar_1.5.1      glue_1.4.2        withr_2.4.1
# [13] DBI_1.1.1         dbplyr_2.1.0      modelr_0.1.8      readxl_1.3.1      lifecycle_1.0.0   plyr_1.8.6
# [19] munsell_0.5.0     gtable_0.3.0      cellranger_1.1.0  rvest_1.0.0       labeling_0.4.2    fansi_0.4.2
# [25] broom_0.7.4       Rcpp_1.0.6        scales_1.1.1      backports_1.2.1   jsonlite_1.7.2    farver_2.1.0
# [31] fs_1.5.0          digest_0.6.27     hms_1.0.0         stringi_1.5.3     grid_4.0.3        rprojroot_2.0.2
# [37] cli_2.3.1         tools_4.0.3       magrittr_2.0.1    crayon_1.4.1      pkgconfig_2.0.3   ellipsis_0.3.1
# [43] prettyunits_1.1.1 xml2_1.3.2        reprex_1.0.0      lubridate_1.7.9.2 assertthat_0.2.1  reshape_0.8.8
# [49] httr_1.4.2        rstudioapi_0.13   R6_2.5.0          compiler_4.0.3