This is the use case for the scales *_format() variants (in this case, percent_format()).
library(ggplot2)
library(scales)
set.seed(12)
#Create a dataset with 3-digits precision:
df <- dplyr::data_frame(xvar = LETTERS[1:5],yvar = round(runif(5, min = 0, max = 0.080), 3))
df$xvar <- as.factor(df$xvar)
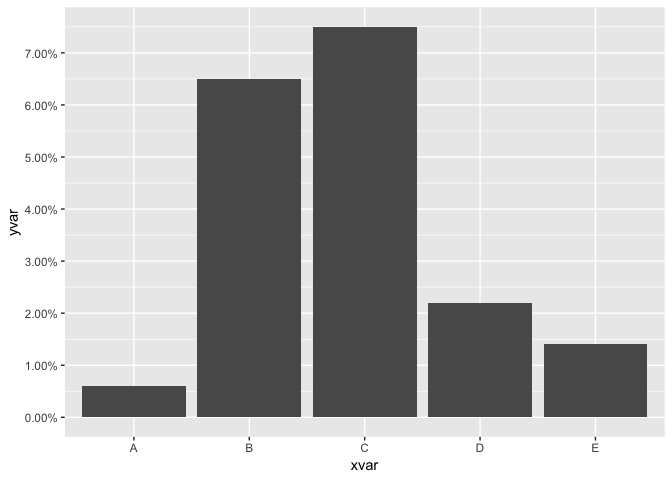
# The diagram shows percent with 2 decimals, but it should only be 1
ggplot(df, aes(xvar, yvar)) +
geom_bar(stat = "identity") +
scale_y_continuous(breaks = pretty_breaks(8), labels = percent)
ggplot(df, aes(xvar, yvar)) +
  geom_bar(stat = "identity") +
  scale_y_continuous(breaks = pretty_breaks(8), labels = percent_format(accuracy = 0.1))

Created on 2018-10-24 by the reprex package (v0.2.1.9000)