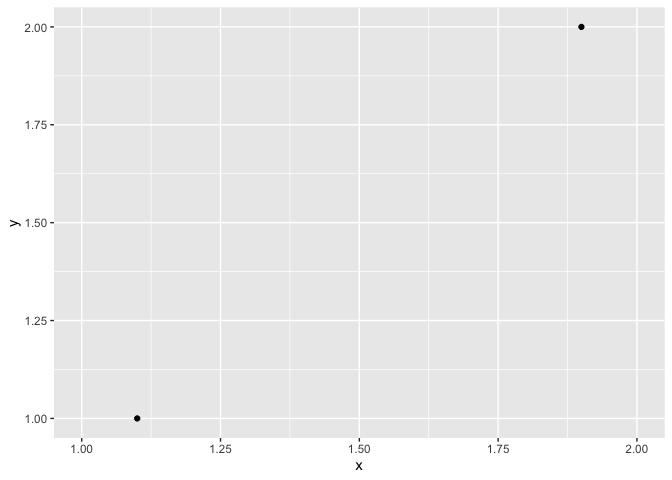
If the graph limits don't already include the value of the "last tick", use the limits argument to ensure that the value is included. If the default breaks don't include a tick-mark at the desired value, then use the breaks argument to add a tick-mark at that value.
library(ggplot2)
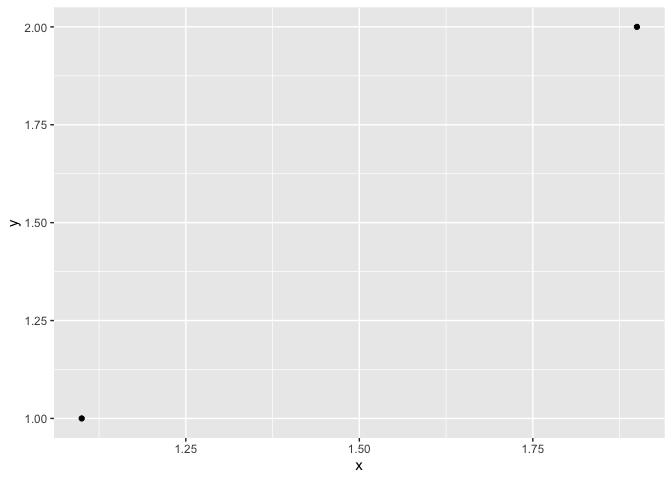
d = data.frame(x=c(1.1, 1.9), y=c(1,2))
ggplot(d, aes(x,y)) +
geom_point()
ggplot(d, aes(x,y)) +
  geom_point() +
  scale_x_continuous(limits=c(1,2))
Created on 2021-10-27 by the reprex package (v2.0.1)