Does this not work for you?
library(ggplot2)
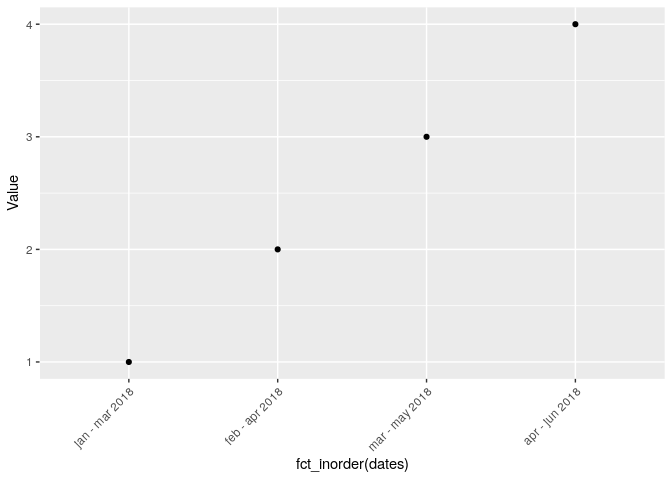
library(forcats)
mydata <- data.frame(dates = c("jan - mar 2018",
"feb - apr 2018",
"mar - may 2018",
"apr - jun 2018"),
Value = 1:4)
ggplot(mydata, aes(fct_inorder(dates), Value)) +
geom_point() +
theme(axis.text.x = element_text(angle=45, hjust=1, vjust=1))
If you need more specific help, please provide a proper REPRoducible EXample (reprex) illustrating your issue.