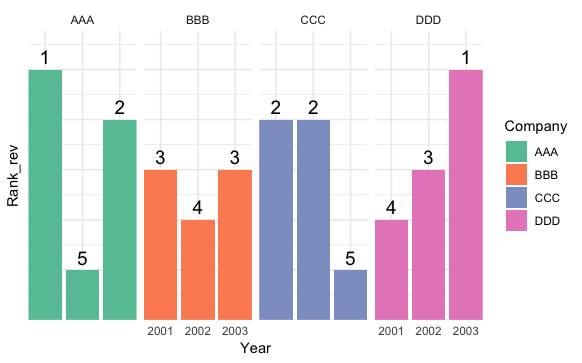
One way to do this is to replace the year values with empty strings of progressively increasing length, and then set space="free_x" and scales="free_x" in facet_grid. You could just hard-code this for your example, but you could also try to make it more general to deal with arbitrary numbers of companies and years, as in the code below.
First we use as.numeric to convert Company into its numeric factor codes and use these as a grouping variable. Then, when this code is odd (as tested by company.numeric %% 2 == 1), we replace the Year values with a sequence of blank strings (if Year isn't already sorted, it needs to be sorted before doing this).
# For every other Company, replace Year with a sequence of blank strings
dat.update = dat %>%
  group_by(company.numeric = as.numeric(Company)) %>%
  mutate(Year = case_when(company.numeric %% 2 == 1 ~ map_chr(1:n(), ~ paste(rep(" ", .x), collapse="")),
                           TRUE ~ as.character(Year)))

myplot <- ggplot(dat.update, aes(x = Year, y = Rank_rev)) +
  facet_grid(.~ Company, scales="free_x", space="free_x")  +
  ... # (rest of plot code is unchanged)

myplot
