This is super-hacky and I'm sure there is a better way, but I think it works?!
library(tidyverse)
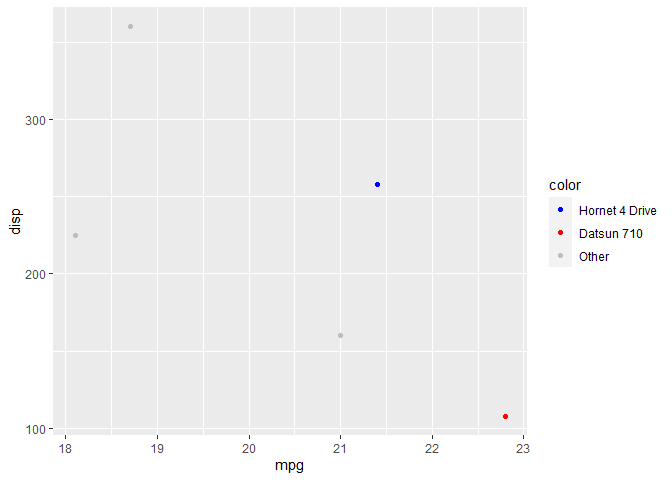
mtcars %>%
mutate(
car_name = rownames(mtcars),
color = case_when(
car_name == "Datsun 710" ~ "red",
car_name == "Hornet 4 Drive" ~ "blue",
TRUE ~ "gray"
),
color = fct_relevel(color, "gray", after = Inf)
) %>%
head() %>%
ggplot() +
geom_point(aes(x = mpg, y = disp, color = color)) +
scale_color_identity(
labels = c(gray = "Other", red = "Datsun 710", blue = "Hornet 4 Drive"),
guide = "legend"
)
Created on 2020-06-08 by the reprex package (v0.3.0)