If I correctly understand what you are trying to do, I think you can use factors on the x-axis instead of dates and use facet_grid() with space = "free" argument.
library(ggplot2)
gapl151618_wetCS <- data.frame(stringsAsFactors=FALSE,
N_ug_m2_h = c(0.59172415, 0.79847845, -2.02633456, 2.038778, -1.19586851,
0.00776147, 6.995, 7.97983333, 2.98933333, -1.65866667,
5.52157486, 5.05983333, 7.28733333, 3.82466667, 0.3075, -0.09014181),
se_graph = c(1.1529715, 0.5764257, -1.8041389, 2.2450879, -1.9191906,
0.5356943, 2.252432, 2.6705785, 2.3721254, -1.1795099,
1.4964004, 3.2670861, 1.5233716, 3.5809984, 1.4447466, -3.8432439),
Date = as.Date(c("2018-06-15", "2018-07-01", "2018-09-19", "2018-06-15",
"2018-07-01", "2018-09-19", "2016-07-07", "2016-07-18",
"2016-08-01", "2016-08-15", "2015-08-06", "2016-07-07", "2016-07-18",
"2016-08-01", "2016-08-15", "2015-08-06")),
Trt = c("C", "C", "C", "S", "S", "S", "C", "C", "C", "C", "C", "S",
"S", "S", "S", "S"),
Year = c(2018, 2018, 2018, 2018, 2018, 2018, 2016, 2016, 2016, 2016,
2015, 2016, 2016, 2016, 2016, 2015)
)
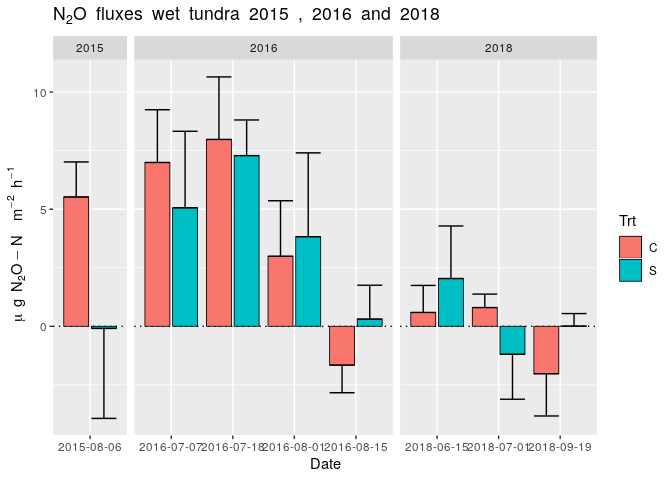
ggplot(gapl151618_wetCS, aes(x= as.factor(Date), y=N_ug_m2_h, fill=Trt))+
geom_hline (yintercept=0, color = "black", linetype = 3 ) +
facet_grid(~Year, scales="free", space = "free") +
geom_bar(position = position_dodge2 (width = 1), stat = "identity", colour="black", size=.3) +
geom_errorbar(aes(ymin=N_ug_m2_h, ymax=N_ug_m2_h+se_graph, group = Trt), position = position_dodge2 ()) +
ylab(expression(~mu~g~N[2]*O-N~~m^{-2}~h^{-1})) +
xlab("Date") +
ggtitle(expression(N[2]*O~fluxes~wet~tundra~2015~","~2016~and~2018))
Created on 2019-10-15 by the reprex package (v0.3.0.9000)
Note: Next time, please try to narrow down your code to just the relevant part and provide a proper REPRoducible EXample (reprex)