FJCC is right, but even with your syntax you should be getting a result, so it is very likely that there is a problem with the structure of your data set. In order to help you with that please provide a minimal REPRoducible EXample (reprex) of your issue.
For example this is a reprex with some built-in data, you could do the same but with a subset of your own data.
library(ggplot2)

diseases_california <- iris # Madeup data

ggplot() +
    geom_point(diseases_california, mapping = aes(x = diseases_california[,1],
                                                  y = diseases_california[,2]))
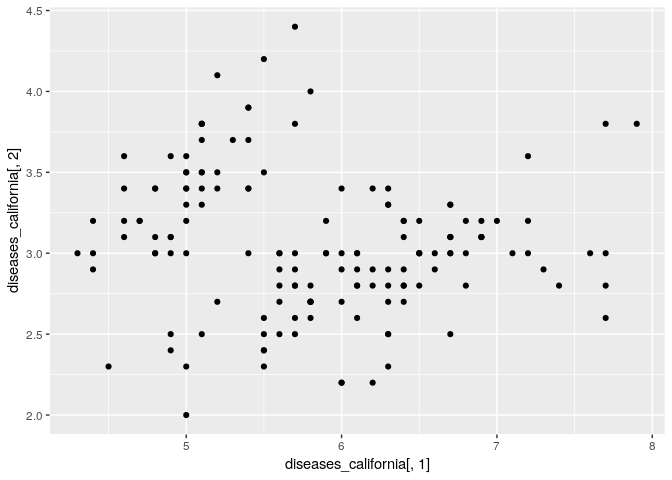
Created on 2019-06-02 by the reprex package (v0.3.0)