Here are three examples of graphing a simple data frame which may help you understand how the reorder function works. It orders the first argument as a function of the second argument. Also, keep in mind that you are using coord_flip, so you reorder the x axis and then it is flipped to become the y axis.
library(ggplot2)
df <- data.frame(Name = c("B", "C", "D", "A"), Number = c(4, 7, 2, 9))
df
#> Name Number
#> 1 B 4
#> 2 C 7
#> 3 D 2
#> 4 A 9
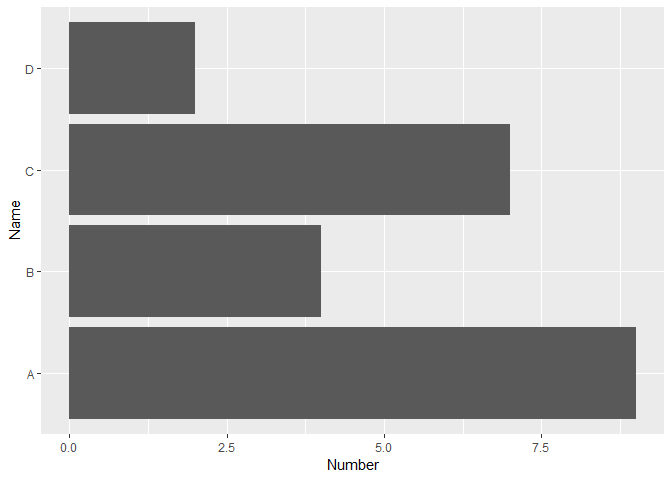
ggplot(data = df, mapping = aes(x = Name, y = Number)) +
geom_bar(stat = "identity") + coord_flip()
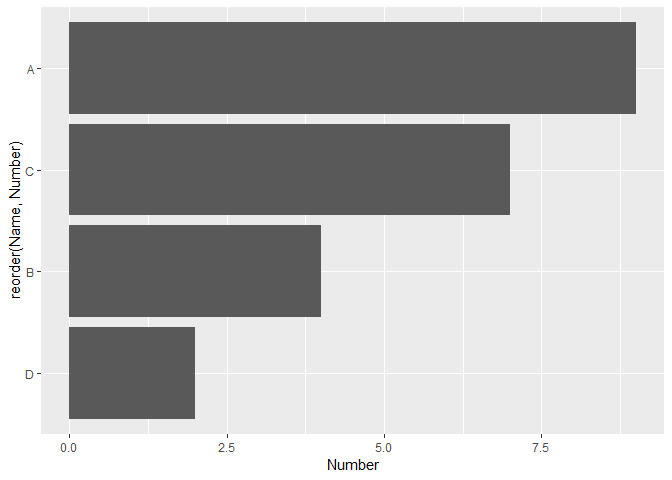
ggplot(data = df, mapping = aes(x = reorder(Name, Number), Number)) +
  geom_bar(stat = "identity") + coord_flip()
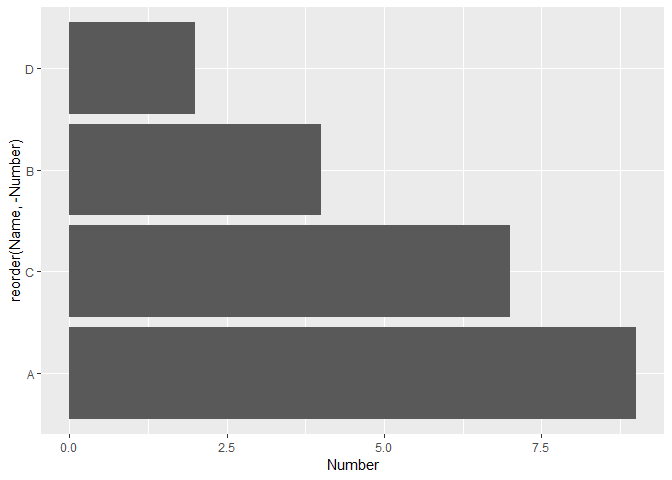
ggplot(data = df, mapping = aes(x = reorder(Name, -Number), Number)) +
  geom_bar(stat = "identity") + coord_flip()
Created on 2019-05-18 by the reprex package (v0.2.1)