Here is my solution, using do() with group_by
- Make a function that returns a dataframe with 10 rows and 21 columns.
get_quantiles <- function(x) {
	values <- x$rainfall_per_square_meter
	t = quantile(values, seq(.1,.9,.1))
	df <- data.frame(quantile_value = t, quantile = seq(.1,.9,.1))
	return(df)
}
- Use
group_bywithdo()to make an output dataframe that hasget_quantilesmapped across years and appended.
df2 <- df %>% group_by(year) %>%
do(get_quantiles(.))
Next steps are to make my get_quantiles function more extensible to use different variables and sets of quantiles.
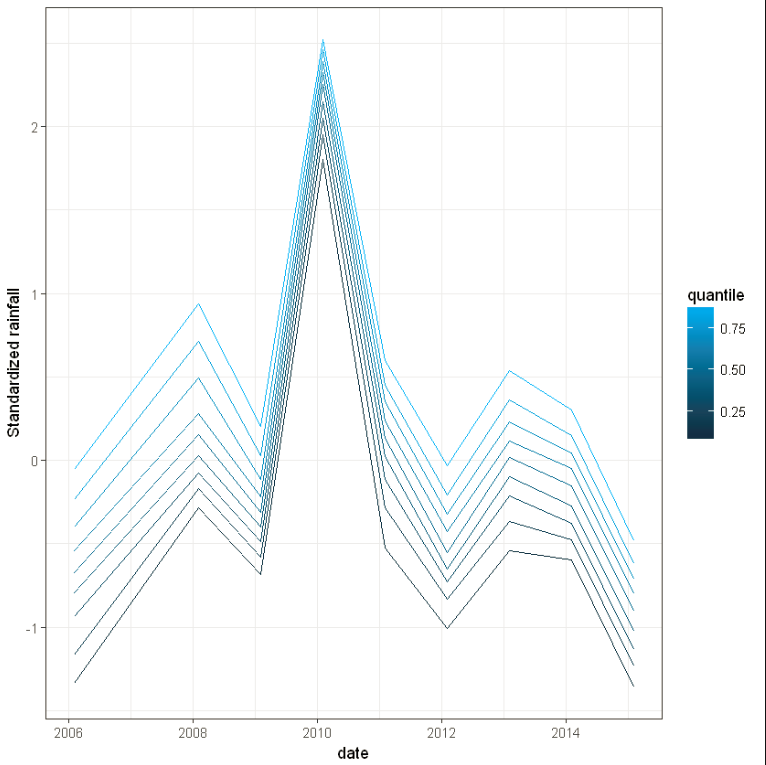
My new plot now looks like this: