I don't think this is an issue. I took a quick look at the code but it couldn't see a skimmable reprex that would allow me to quickly understand the problem.
1 Like
It behaves the same as geom_line. The only time a group aesthetic is usually necessary is to make line/smooth plots with a discrete x variable.
As @lbusett was pushing towards, that gets to why you're getting unpredictable behavior, too: you're asking geom_smooth to do two things. Setting a colour aesthetic tells it to split the smooths in the second facet in two, but the group aesthetic tells it that there should only be one per facet.
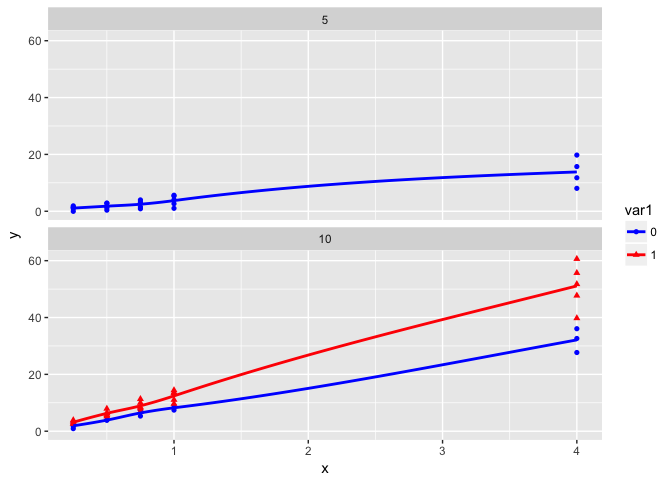
If you want a smooth for each set of var1 values per panel, just drop the group aesthetic:
df <- data.frame(id = c(1L, 1L, 1L, 1L, 2L, 2L, 2L, 2L, 3L, 3L, 3L, 3L, 4L, 4L, 4L, 4L, 5L, 5L, 5L, 5L, 6L, 6L, 6L, 6L, 7L, 7L, 7L, 7L, 8L, 8L, 8L, 8L, 9L, 9L, 9L, 9L, 10L, 10L, 10L, 10L, 11L, 11L, 11L, 11L, 12L, 12L, 12L, 12L, 13L, 13L, 13L, 13L, 14L, 14L, 14L, 14L, 15L, 15L, 15L, 15L),
                 x = c(0.25, 0.5, 0.75, 1, 4, 0.25, 0.5, 0.75, 1, 4, 0.25, 0.5, 0.75, 1, 4, 0.25, 0.5, 0.75, 1, 4, 0.25, 0.5, 0.75, 1, 4, 0.25, 0.5, 0.75, 1, 4, 0.25, 0.5, 0.75, 1, 4, 0.25, 0.5, 0.75, 1, 4, 0.25, 0.5, 0.75, 1, 4, 0.25, 0.5, 0.75, 1, 4, 0.25, 0.5, 0.75, 1, 4, 0.25, 0.5, 0.75, 1, 4),
                 y = c(-0.0302378232761063, 0.38491125525836, 1.52935415707456, 1.03525419571229, 8.06464386758047, 1.35753249344164, 1.2304581029946, 0.867469382696733, 2.65657357405324, 11.77716901495, 1.36204089871973, 1.67990691352868, 3.20038572529703, 4.05534135797256, 15.722079432623, 1.89345656840154, 2.74892523911462, 2.76669142168518, 5.35067795078184, 19.763604296136, 0.966088147006577, 2.89101254267085, 3.98699777584638, 5.63555438535443, 27.6874803660754, 0.906653344628793, 3.91889352224726, 5.32668655891826, 7.43093153149403, 32.626907460535, 1.71976217672389, 3.88491125525836, 7.52935415707456, 9.03525419571229, 36.0646438675805, 3.10753249344164, 5.2304581029946, 6.86746938269673, 9.65657357405324, 39.77716901495, 3.36204089871973, 5.67990691352868, 8.45038572529703, 11.0553413579726, 47.722079432623, 3.89345656840154, 6.24892523911462, 8.01669142168518, 13.3506779507818, 51.763604296136, 2.71608814700658, 6.39101254267085, 9.98699777584638, 13.6355543853544, 55.6874803660754, 2.65665334462879, 7.91889352224726, 11.3266865589183, 14.430931531494, 60.626907460535),
                 panel = c(5, 5, 5, 5, 5, 5, 5, 5, 5, 5, 5, 5, 5, 5, 5, 5, 5, 5, 5, 5, 5, 5, 5, 5, 10, 10, 10, 10, 10, 10, 10, 10, 10, 10, 10, 10, 10, 10, 10, 10, 10, 10, 10, 10, 10, 10, 10, 10, 10, 10, 10, 10, 10, 10, 10, 10, 10, 10, 10, 10),
                 var1 = structure(c(1L, 1L, 1L, 1L, 1L, 1L, 1L, 1L, 1L, 1L, 1L, 1L, 1L, 1L, 1L, 1L, 1L, 1L, 1L, 1L, 1L, 1L, 1L, 1L, 1L, 1L, 1L, 1L, 1L, 1L, 1L, 1L, 1L, 1L, 1L, 1L, 2L, 2L, 2L, 2L, 2L, 2L, 2L, 2L, 2L, 2L, 2L, 2L, 2L, 2L, 2L, 2L, 2L, 2L, 2L, 2L, 2L, 2L, 2L, 2L), .Label = c("0", "1"), class = "factor"),
                 var2 = structure(c(1L, 1L, 1L, 1L, 1L, 1L, 1L, 1L, 1L, 1L, 1L, 1L, 1L, 1L, 1L, 1L, 2L, 2L, 2L, 2L, 1L, 1L, 1L, 1L, 1L, 1L, 1L, 1L, 2L, 2L, 2L, 2L, 2L, 2L, 2L, 2L, 1L, 1L, 1L, 1L, 1L, 1L, 1L, 1L, 1L, 1L, 1L, 1L, 1L, 1L, 1L, 1L, 1L, 1L, 1L, 1L, 1L, 1L, 1L, 1L), .Label = c("0", "1"), class = "factor"))

library(ggplot2)

ggplot(df, aes(x, y, colour = var1, shape = var1)) +
    geom_point() +
    geom_smooth(method = 'loess', se = FALSE, span = 2/3) +
    facet_wrap('panel', scales = 'fixed', ncol = 1) +
    scale_color_manual(values = c('blue', 'red'))
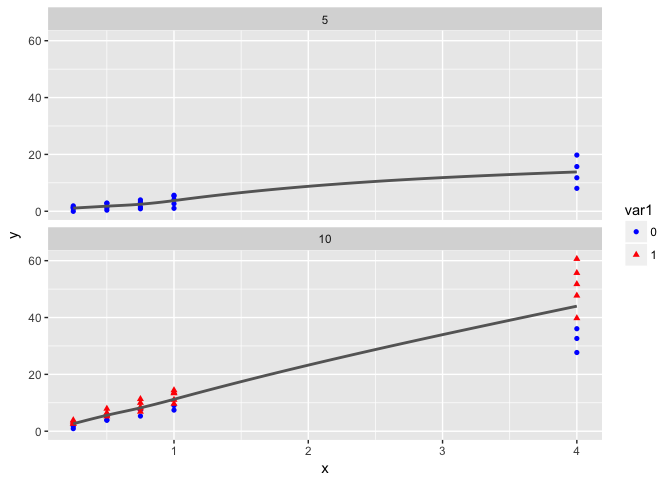
If you want a single smooth per facet, only set the colour aesthetic for geom_point:
ggplot(df, aes(x, y)) +
    geom_point(aes(colour = var1, shape = var1)) +
    # changed line color to gray so as not to confuse default blue with var1 0's blue
    geom_smooth(colour = 'gray40', method = 'loess', se = FALSE, span = 2/3) +
    facet_wrap('panel', scales = 'fixed', ncol = 1) +
    scale_color_manual(values = c('blue', 'red'))
1 Like
I am sorry to say that I disagree with both statements.
First, I see many instances in my field of work where the group and colour variable must be different even for continuous x variables.
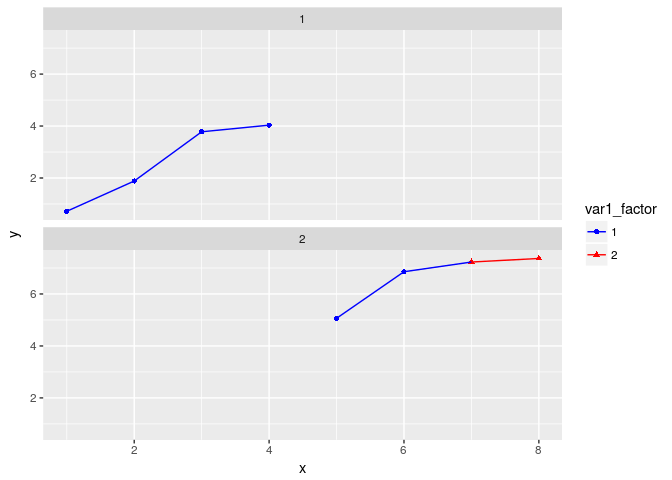
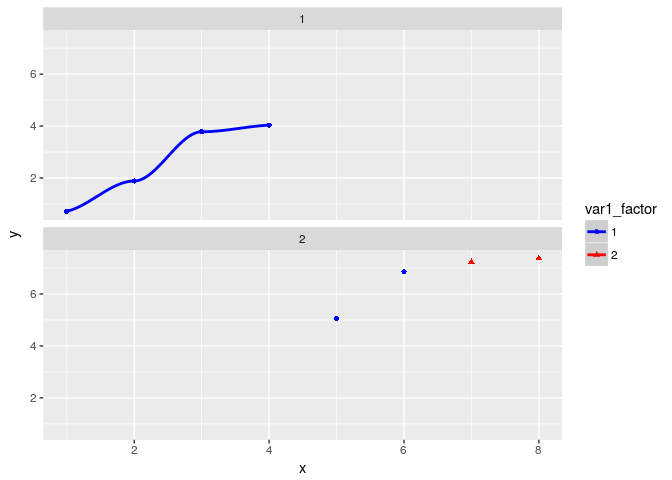
More importantly, the geom_line function does not behave the same as geom_smooth, as shown below: geom_line adequately inherits and handles the group and colour aesthetics when the group variable has only one value and the colour variable has 2, contrary to geom_smooth. Geom_line creates a single line for both panels and distributes the colors according to the colour variable, while geom_smooth does not draw the smooth line in the 2nd panel. I guess it is harder for it to know when to switch colour, but, I would have expected that it would at least revert to some kind of default colour (maybe it does if this colour is "transparent").
Geom_smooth is maybe supposed to behave like it does, but this behavior seems data-dependent and theme-dependent in a way that it not obvious to me (see cases 2, 3 and 4 in my original post).
require(ggplot2)
#> Loading required package: ggplot2

options(warn = -1)

set.seed(123)

df <- data.frame(
  x = 1:8,
  y = 1:8 + rnorm(8,0,0.5),
  panel = c(1,1,1,1,2,2,2,2),
  var1_factor = factor(c(1,1,1,1,1,1,2,2))
)

ggplot(data = df,
  aes_string(x = 'x',
    y = 'y',
    group = 'panel',
    colour = 'var1_factor',
    shape = 'var1_factor'))  +
  geom_point() +
  geom_line() +
  facet_wrap('panel', scales = 'fixed', nrow = 2, ncol = 1) +
  scale_colour_manual(values = c('blue', 'red'))
ggplot(data = df,
  aes_string(x = 'x',
    y = 'y',
    group = 'panel',
    colour = 'var1_factor',
    shape = 'var1_factor'))  +
  geom_point() +
  geom_smooth() +
  facet_wrap('panel', scales = 'fixed', nrow = 2, ncol = 1) +
  scale_colour_manual(values = c('blue', 'red'))
#> `geom_smooth()` using method = 'loess'
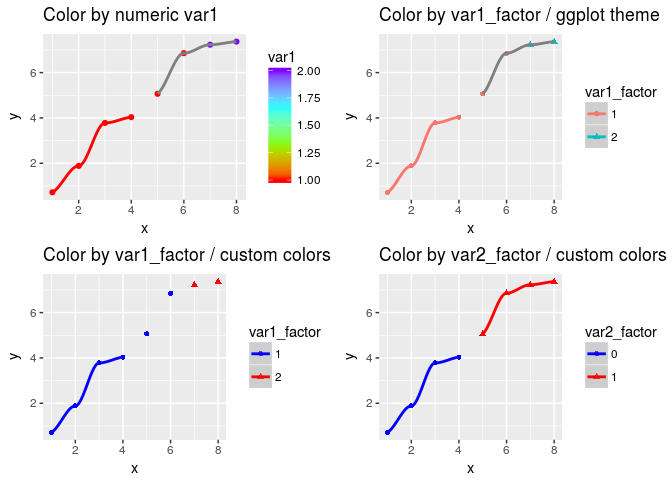
I am taking another stab at it with a more compact example, in the hope to convince you that there may by something here. The supporting data is small (but still meaningless) and faceting was dropped.
The problem is that, when group and colour aesthetics are set, smooth lines may or may not be drawn depending on the variables used for colour aesthetic and depending on the use of default or custom colors (I am guessing this has nothing to do with the actual colors, but how the scale_colour_manual function overrides the default theme).
I would greatly appreciate if you could give this problem a 2nd look.
require(ggplot2)
#> Loading required package: ggplot2
require(gridExtra)
#> Loading required package: gridExtra
options(warn=-1) # turn off warnings from loess function
set.seed(123)
df <- data.frame(
x = 1:8,
y = (1:8) + rnorm(8,0,0.5),
panel = c(1,1,1,1,2,2,2,2),
var1 = c(1,1,1,1,1,1,2,2),
var1_factor = factor(c(1,1,1,1,1,1,2,2)),
var2 = rep(0:1, each = 4),
var2_factor = factor(rep(0:1, each = 4))
)
df
#> x y panel var1 var1_factor var2 var2_factor
#> 1 1 0.7197622 1 1 1 0 0
#> 2 2 1.8849113 1 1 1 0 0
#> 3 3 3.7793542 1 1 1 0 0
#> 4 4 4.0352542 1 1 1 0 0
#> 5 5 5.0646439 2 1 1 1 1
#> 6 6 6.8575325 2 1 1 1 1
#> 7 7 7.2304581 2 2 2 1 1
#> 8 8 7.3674694 2 2 2 1 1
p1 <- ggplot(data = df,
aes_string(x = 'x',
y = 'y',
group = 'panel',
colour = 'var1')) +
geom_point() +
geom_smooth() +
labs(title = 'Color by numeric var1') +
scale_colour_gradientn(colors = rainbow(4))
gplot <- ggplot(data = df,
aes_string(x = 'x',
y = 'y',
group = 'panel',
colour = 'var1_factor',
shape = 'var1_factor')) +
geom_point() +
geom_smooth()
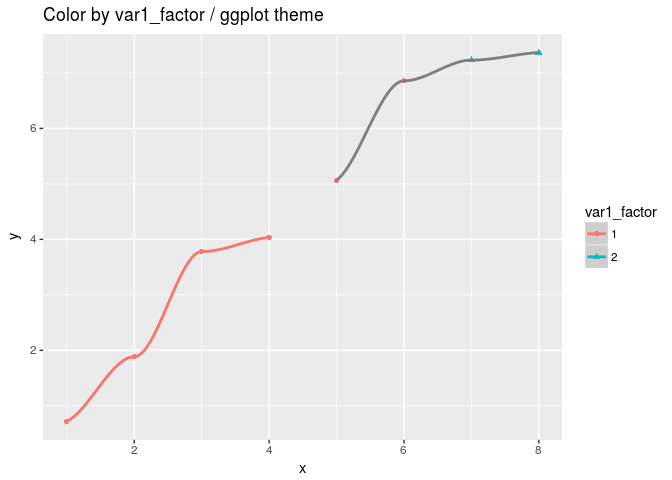
p2 <- gplot + labs(title = 'Color by var1_factor / ggplot theme')
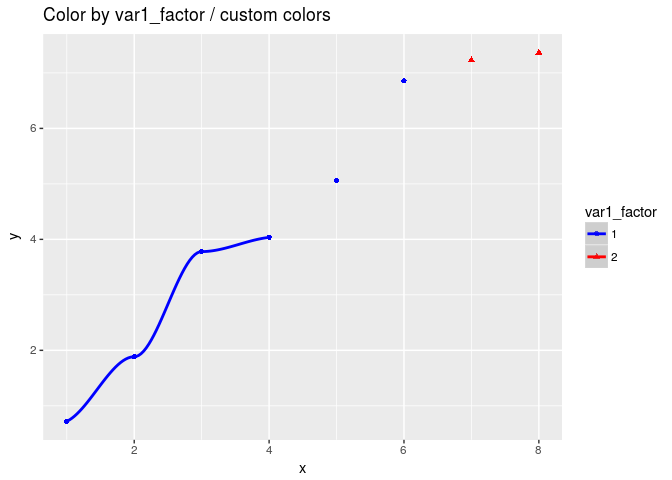
p3 <- gplot +
labs(title = 'Color by var1_factor / custom colors') +
scale_colour_manual(values = c('blue', 'red'))
p4 <- gplot <- ggplot(data = df,
aes_string(x = 'x',
y = 'y',
group = 'panel',
colour = 'var2_factor',
shape = 'var2_factor')) +
geom_point() +
geom_smooth() +
labs(title = 'Color by var2_factor / custom colors') +
scale_colour_manual(values = c('blue', 'red'))
grid.arrange(p1, p2, p3, p4, nrow=2, ncol=2)
#> `geom_smooth()` using method = 'loess'
#> `geom_smooth()` using method = 'loess'
#> `geom_smooth()` using method = 'loess'
#> `geom_smooth()` using method = 'loess'
Can you please use aes() instead of aes_string(), and reduce your examples down to just one "good" vs. one bad"? (And eliminate all the fancy layout stuff so I can print the plots as easily as possible)
I believe there are multiple angles to this problem, hence the 4 different plots in my previous post. However, to address your request and get the ball rolling, here is an example addressing the impact of custom theming. It shows 2 plots using the same data and code (with the requested changes) except that a scale_colour_manual is applied in the 2nd plot.
require(ggplot2)
#> Loading required package: ggplot2

options(warn=-1)  # turn off warnings from loess function
set.seed(123)
df <- data.frame(
  x = 1:8,
  y = (1:8) + rnorm(8,0,0.5),
  panel = c(1,1,1,1,2,2,2,2),
  var1 = c(1,1,1,1,1,1,2,2),
  var1_factor = factor(c(1,1,1,1,1,1,2,2)),
  var2 = rep(0:1, each = 4),
  var2_factor = factor(rep(0:1, each = 4))
)

gplot <- ggplot(data = df,
  aes(x = x,
    y = y,
    group = panel,
    colour = var1_factor,
    shape = var1_factor))  +
  geom_point() +
  geom_smooth()
p2 <- gplot + labs(title = 'Color by var1_factor / ggplot theme')

p3 <- gplot +
  labs(title = 'Color by var1_factor / custom colors') +
  scale_colour_manual(values = c('blue', 'red'))

df
#>   x         y panel var1 var1_factor var2 var2_factor
#> 1 1 0.7197622     1    1           1    0           0
#> 2 2 1.8849113     1    1           1    0           0
#> 3 3 3.7793542     1    1           1    0           0
#> 4 4 4.0352542     1    1           1    0           0
#> 5 5 5.0646439     2    1           1    1           1
#> 6 6 6.8575325     2    1           1    1           1
#> 7 7 7.2304581     2    2           2    1           1
#> 8 8 7.3674694     2    2           2    1           1
p2
#> `geom_smooth()` using method = 'loess'
p3
#> `geom_smooth()` using method = 'loess'
Thanks. I simplified a little further to:
library(ggplot2)
set.seed(123)
df <- data.frame(
x = 1:8,
y = (1:8) + rnorm(8,0,0.5),
panel = c(1,1,1,1,2,2,2,2),
var1 = c(1,1,1,1,1,1,2,2),
var1_factor = factor(c(1,1,1,1,1,1,2,2)),
var2 = rep(0:1, each = 4),
var2_factor = factor(rep(0:1, each = 4))
)
g1 <- ggplot(df, aes(x, y, group = panel, colour = var1_factor, shape = var1_factor)) +
geom_point() +
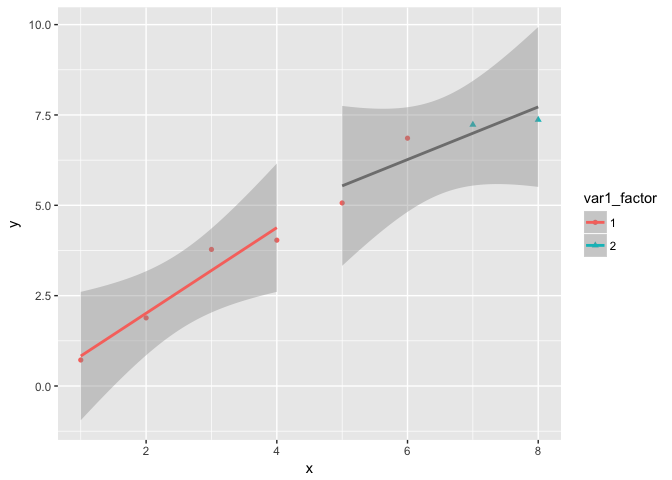
geom_smooth(method = "lm")
g1
g1 + scale_colour_manual(values = c('blue', 'red'))
(No reprex because I'm having some issues uploading the generated image).
This code makes the issue a bit easier to see because lm() can draw standard errors for this code, while loess cannot. The key problem comes down to: "what colour should the right smooth have"? The underlying data is a mixed of blue and red points, so some default kicks in (and I'm guessing here) assigns it a colour of NA, and default colour scale draws NAs as grey.
It's possible that there's a small bug here in that scale_colour_manual() is not applying na.value to give the missing values a colour, but given that this problem is rare, and there's an easy existing work around (make sure each group has unique colours), it's unlikely that this issue would ever rise to the top of my priority list.
reprex with output for @hadley's code, above:
library(ggplot2)
set.seed(123)
df <- data.frame(
  x = 1:8,
  y = (1:8) + rnorm(8,0,0.5),
  panel = c(1,1,1,1,2,2,2,2),
  var1 = c(1,1,1,1,1,1,2,2),
  var1_factor = factor(c(1,1,1,1,1,1,2,2)),
  var2 = rep(0:1, each = 4),
  var2_factor = factor(rep(0:1, each = 4))
)

g1 <- ggplot(df, aes(x, y, group = panel, colour = var1_factor, shape = var1_factor)) +
  geom_point() +
  geom_smooth(method = "lm")

g1
g1 + scale_colour_manual(values = c('blue', 'red'))

Created on 2018-03-03 by the reprex package (v0.2.0).