Hi @gongcastro!
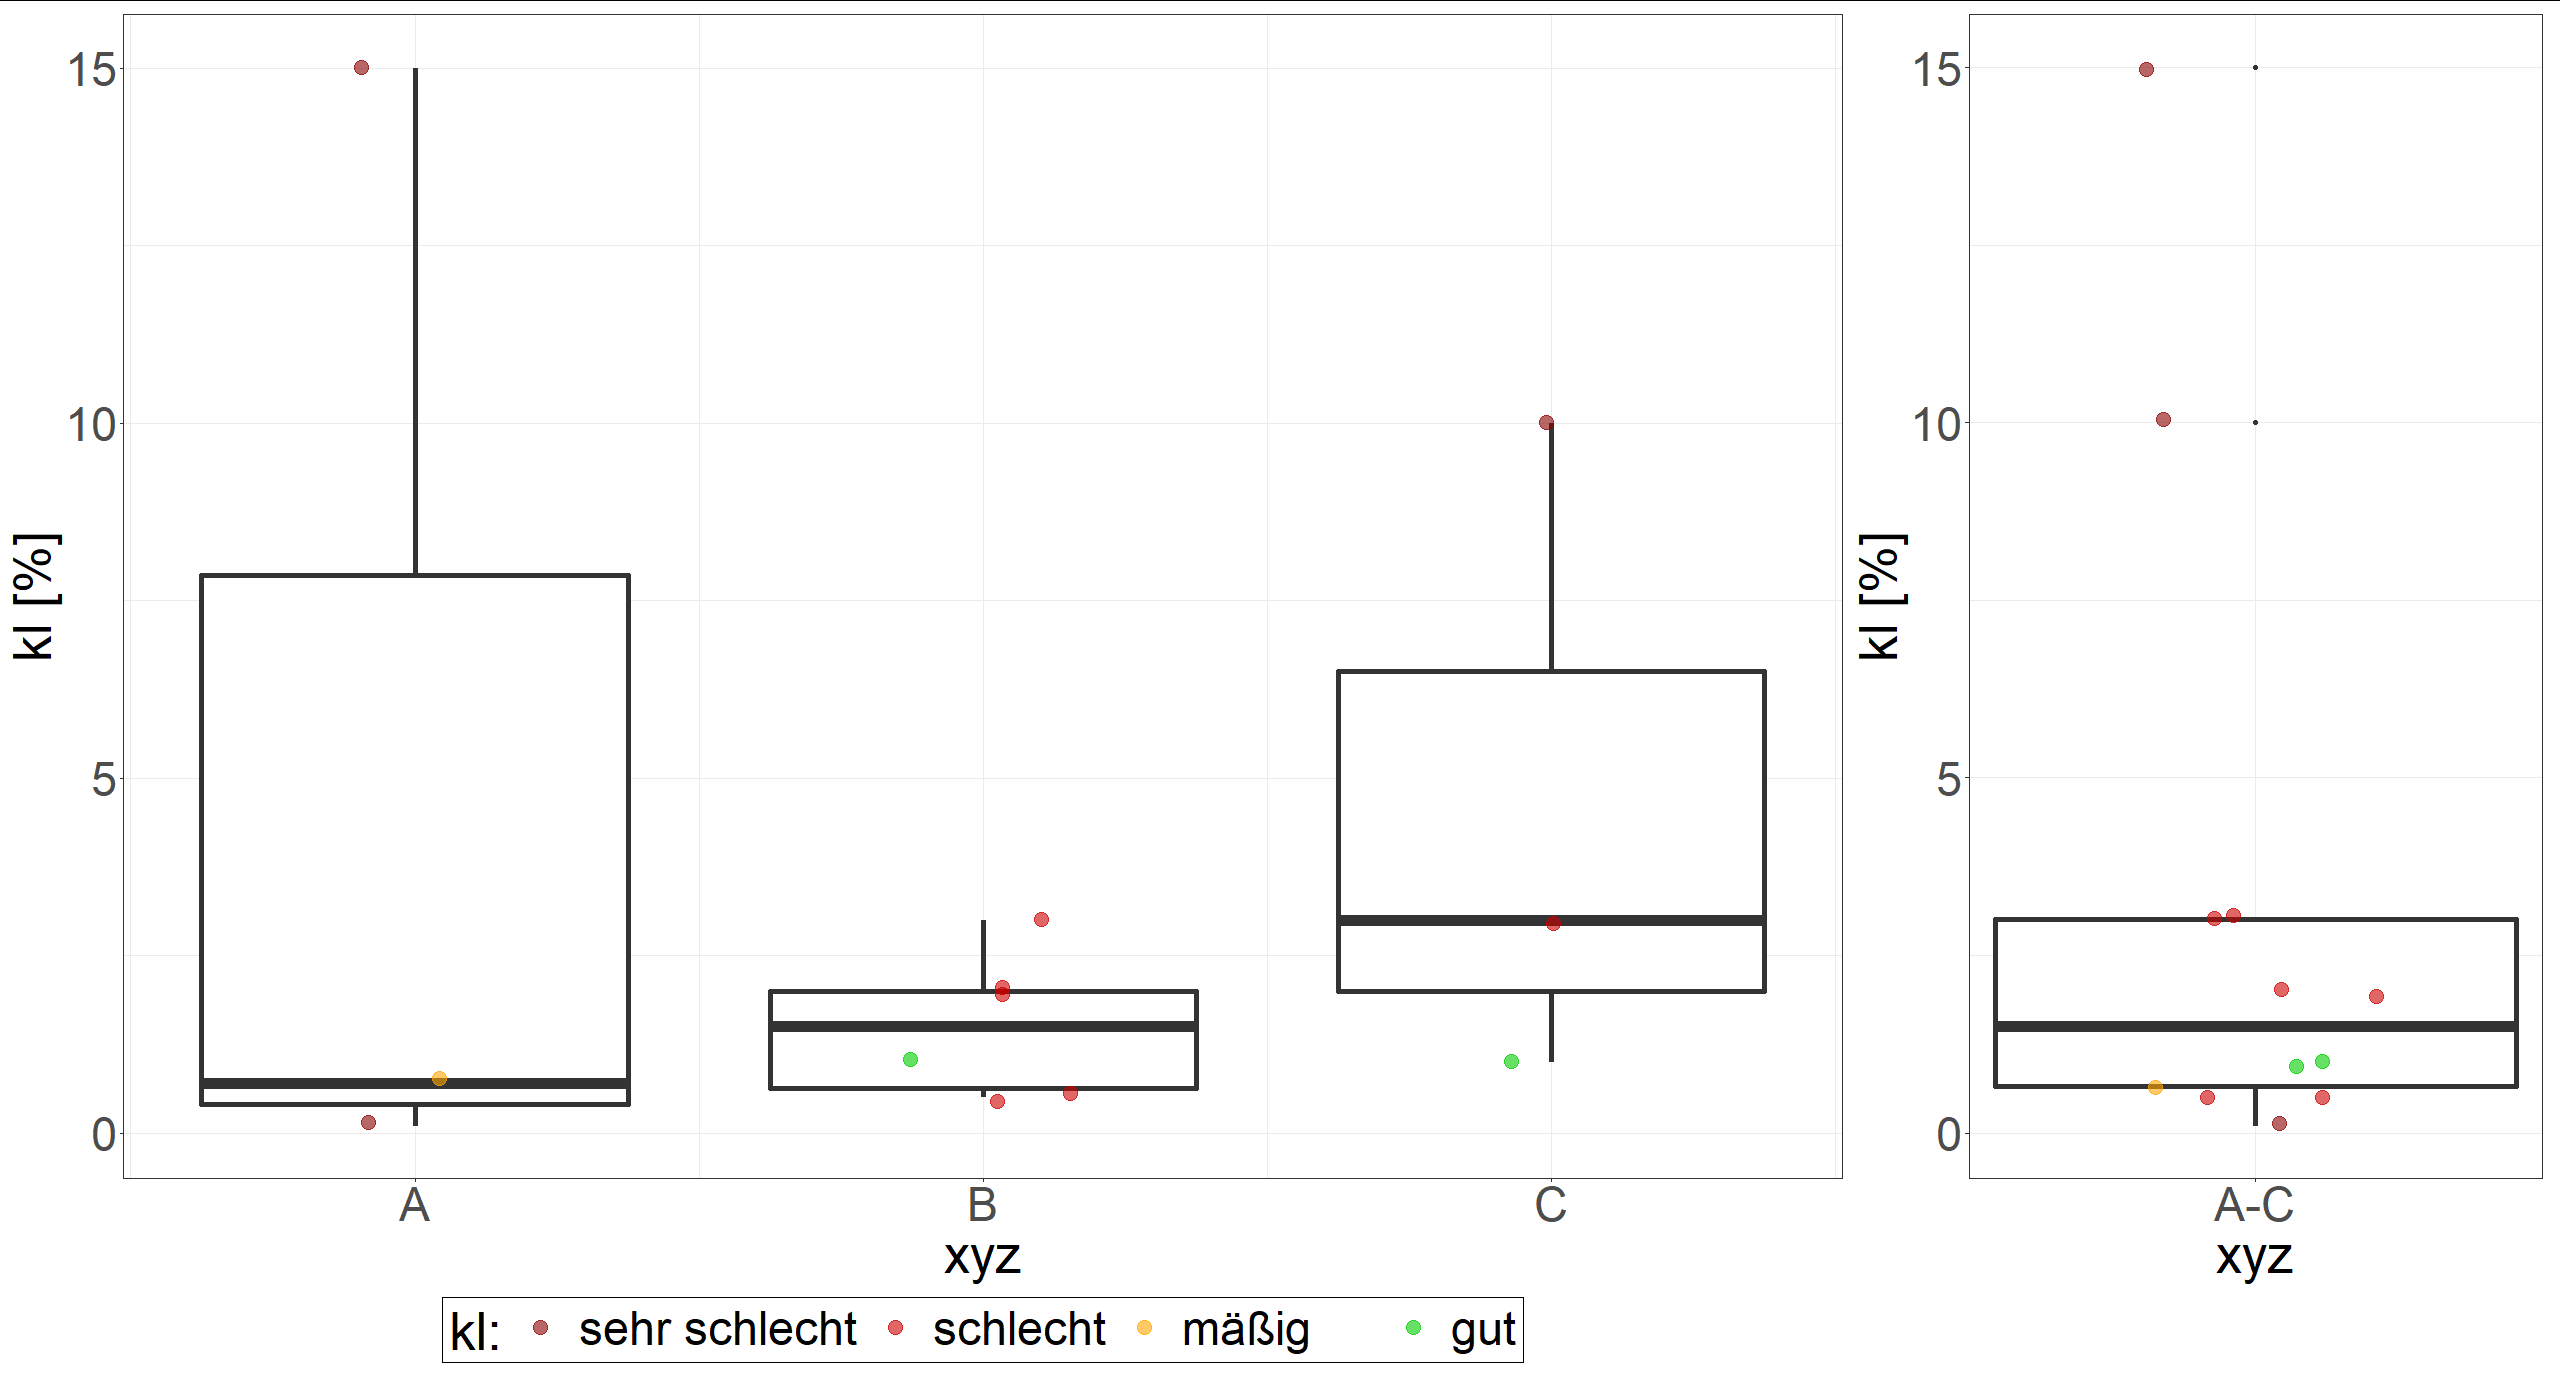
Thanks a lot, that was what I was looking for. I changed the widths , so that the extra boxplot has the same size as all the others boxplots.
gleich_entf_kat <- c(5,3,3,4,3,3,3,3,1,5,1,1)
gleich_entf_fakt <- c(1,3,0.5,0.7,3,2,2,0.5,0.1,1,10,15)
hh_wohnbdl <- c(3,2,2,1,3,2,2,2,1,2,3,1)
df <- data.frame(gleich_entf_kat,gleich_entf_fakt,hh_wohnbdl) %>%
  drop_na(gleich_entf_kat, hh_wohnbdl, gleich_entf_fakt)

plot1 <-  ggplot(df, mapping = aes(
  x = hh_wohnbdl,
  y = gleich_entf_fakt
)) +
  geom_boxplot(aes(group=hh_wohnbdl),size=2) +
  geom_jitter(size=5, position=position_jitter(0.2),aes(color = factor(gleich_entf_kat)), alpha=0.6)+
  scale_color_manual(values = c("red4", "red3", "orange", "green3", "green4"), labels = c("sehr schlecht", "schlecht", "mäßig", "gut", "sehr gut"),guide = guide_legend(shape = c(rep(16, 7), NA, NA),size=15)) +
  scale_x_continuous(breaks = 1:3, name = "xyz", labels = c("A", "B", "C")) +
  scale_fill_manual(breaks = 1:3, name = "xyz", labels = c("A", "B", "C")) +
  labs(x = "xyz",
       y = "kl [%]",
       color = "kl:",size=50) +
  theme_bw()+
  theme(axis.text.x = element_text(size = 35),axis.title.x = element_text(size = 40),axis.text.y = element_text(size = 35),axis.title.y = element_text(size = 40),legend.title = element_text(size = 40),legend.text = element_text(size=35),legend.position = "bottom",legend.background = element_rect(color = "black",fill = "transparent"))

plot2 <-  ggplot(df, mapping = aes(
  x = 1,
  y = gleich_entf_fakt
)) +
  geom_boxplot(size=2) +
  geom_jitter(size=5, position=position_jitter(0.2),aes(color = factor(gleich_entf_kat)), alpha=0.6,show.legend = FALSE)+
  scale_color_manual(values = c("red4", "red3", "orange", "green3", "green4"), labels = c("sehr schlecht", "schlecht", "mäßig", "gut", "sehr gut"),guide = guide_legend(shape = c(rep(16, 7), NA, NA),size=15)) +
  scale_x_continuous(breaks = 1, name = "xyz", labels = c("A-C")) +
  scale_fill_manual(breaks = 1, name = "xyz", labels = c("A-C")) +
  labs(x = "xyz",
       y = "kl [%]",
       color = "kl:",size=50) +
  theme_bw()+
  theme(axis.text.x = element_text(size = 35),axis.title.x = element_text(size = 40),axis.text.y = element_text(size = 35),axis.title.y = element_text(size = 40),legend.title = element_text(size = 40),legend.text = element_text(size=35),legend.position = "bottom",legend.background = element_rect(color = "black",fill = "transparent"))

plot1 + plot2 + plot_layout(nrow = 1, widths = c(3,1))
And the plot: