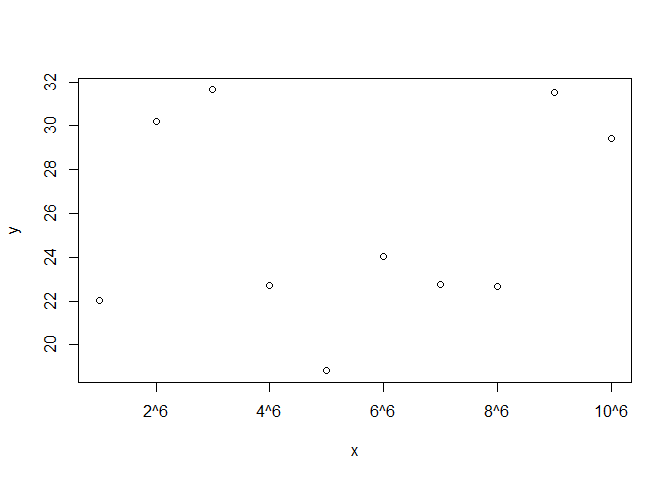
Here is one way to set the x axis labels.
df <- data.frame(x = seq(1E6, 10E6, 1E6),
                 y = rnorm(10, 25, 6))
plot(y ~ x, data = df, xaxt = "n")
axis(1, at = seq(2E6, 10E6, 2E6), labels = c("2^6", "4^6", "6^6", "8^6", "10^6"))
Created on 2019-06-26 by the reprex package (v0.2.1)